Option FanaticOptions, stock, futures, and system trading, backtesting, money management, and much more!

Fire and Fortitude in Algorithmic Trading (Part 1)

Today I want to review where I’ve been (starting here) in this discussion of algorithmic trading and then move forward.

I have three main critiques of technical analysis (TA). First, it’s not always objective (as discussed here and here). Second, it’s rarely backed by supporting evidence. Finally, it seems really difficult to find viable trading strategies.

With regard to critique #3, I feel like I want to climb to the nearest mountaintop and yell “nothing works, folks!” An infinite number of possible strategies await to be tested, though, as mentioned in [1]. If I have 40 different indicators then I can test them on 20 different markets, throw in daily + 4h + hourly + 5m time frames, and voila: 3,200 strategies. What I have tested in my first three months is tiny in comparison.

Seldom have I experienced failure like I have in my brief stint as a quant. One by one, I saw hallmarks of popular TA fall by the wayside: momentum, moving averages, Bollinger Bands, RSI, Williams %R, trend-following, mean-reversion, etc. None of these have worked sufficiently well over a long period of time, and many are losers. I went through books with each setup presented accompanied by [deceptive?] claims of live-trading success on different markets. None of these worked either. Having immersed myself in the financial domain for a while, I’m not surprised to see an indicator or two not work very well. I have read books, articles, and sat through countless presentations these indicators over the years, though, and failure to find a single viable strategy, is quite the shock.

My discipline and commitment have eroded over time. I started by testing one strategy per day. As I learned the process better, I increased to two, five, and eventually 10/day. I started to run lean of strategy ideas. It’s very important to have this in strong supply because once my time had to be devoted to finding strategies, my daily testing decreased and I felt less productive as a result. Up until that point, I was able to achieve my daily goal, but as I watched the tally of total strategies tested continue to mount, my frustration and fatigue got real.

What I experienced is to be expected according to algorithmic trading guru KD. KD is a vendor of algorithmic trading education. He has my respect (until he doesn’t, and I’ll let you know if that happens). He says we can expect to find one viable strategy for every 100 – 200 strategies tested. He also says to break for a few weeks if you start to get frustrated and impatient.

In other words, those who undertake this trading approach will need to settle in for a very long haul…

Does Any Technical Analysis Work? (Part 6)

Today I conclude with my internet sample of opinions on whether technical analysis (TA) can actually work.

Here’s an excerpt from an article by Proinsias O’Mahony:

     > While TA remains widely used, that doesn’t mean it’s not bunkum.
     > Indeed, many technical traders would be the first to accept that
     > the field is full of charlatans. As bond expert and author Martin
     > Fridson has written: “The only thing we know for certain about
     > TA is that it’s possible to make a living publishing a newsletter
     > on the subject.”

See my post here.

     > Such newsletters are full of references to obscure Japanese
     > candlestick chart patterns, Elliott Wave theory, Fibonacci
     > numbers, and all kinds of other vague and unverified assertions.

I wrote about some of this here.

After all the opinions in these five posts, what do we have?

The four excerpts from Part 2 are optimistic and give me hope.

The two excerpts from Part 3 suggest that anything we find in books, seminars, or on the internet will not work.

The commentary from Part 4 suggests that no simple indicators will work and that bots available for purchase will not work over the long term. The latter is not new because I don’t expect any system to work forever.

[9] – [11] in Part 5 argue that no bots for sale will ever work, no .pdf guidelines or strategies based in TA will work, no simple TA-based systems will work, and that institutions advertising advanced TA-based departments with oodles of computing power and academic doctorates are really for marketing purposes only.

Today’s excerpts argue against TA like most of the others I have surveyed.

Of all this, I have to hope [1] – [4] is correct. It may not be easy, though. Although my initial impressions do not concur, at least one prolific writer in the algorithmic trading space says simple strategies are all we need.

As an aside, O’Mahony also provides some ammunition in case I ever want to sound off on fundamentals again (see second-to-last paragraph here):

     > The same can be said of fundamental analysis, however.
     > Billionaire investor Mark Cuban once scoffed that “fundamentals
     > is a word invented by sellers to find buyers… metrics created
     > to help stockbrokers sell stocks, and to give buyers reassurance
     > when buying stocks.”
     >
     > That may be cynical, but it’s a documented fact that most
     > fundamental managers underperform the markets. Most investors
     > would be better adopting a buy-and-hold approach rather than
     > painstakingly studying stockbroker notes in a futile attempt
     > to gain an edge.

Do you know if any successful traders even exist?

Next time, I will come back to discussion of my personal experience thus far.

Does Any Technical Analysis Work? (Part 5)

Today I continue with a sample of internet opinions on whether algorithmic trading with TA can actually work.

     > If someone created a bot that is profitable with good metrics,
     > they would never sell it. Ask yourself this: if you have an ATM
     > that magically refills itself every night, would you sell it for
     > petty cash? The ones selling bots are… not producing a
     > profit… [9]

I’ve heard this many times and find it to be a compelling, but not ironclad argument. If I had a large chunk of money then I could certainly turn it into millions. If I had little money, then I might still benefit from selling to others for point-of-sale profit while I execute it myself and make a high return percentage on a small amount. Alternatively, for the sake of diversification I might never want to trade it in large size. Since I could not count on making too much money from this one system, I might as well sell it to others to get some guaranteed money while I continue work on developing others.

     > “There are a lot of people arguing they can make profit just
     > using TA, following some pattern or indicator rule.” A lot of
     > idiots, zeros, make a few dollars a month selling PDFs explaining
     > how to “make millions with simple patterns or indicator rules!!”
     > In contrast… few quants have indeed made a lot of money
     > using incredibly difficult and sophisticated software systems,
     > which have utterly no connection whatsoever to some trivial
     > pattern rules. The bots you have made and you refer to are a
     > joke—the equivalent of looking up spelling in a dictionary
     > file—whereas quants are like Siri. [10]

I’ve written much in this blog about optionScam.com. Like me, this person has also observed the financial industry to have some nefarious (see third paragraph here) contributors.

     > “I just wanted to know if those public and typical strategies
     > work or if they are just scam to fool beginners like me.” I think
     > they are a scam to fool everyone! You know how large brokerage
     > companies will have a large “TA” department, headed by major
     > experts making millions per year and dozens of PhD staff. Many
     > traders would tell you it’s an utter scam—they just add
     > those departments purely so they can say to clients “well,
     > we have this impressive TA department…” you know? [11]

I’m not a conspiracy theorist (see third paragraph here), but given that a decent amount of misconduct exists in certain segments of the financial industry, I think we need to acknowledge the possibility described. I think the only way to know with more certainty would be to work in the industry proper—maybe for multiple firms to gain perspective on tactics used by a large sample size of institutions.

I will wrap up these comments next time.

Does Any Technical Analysis Work? (Part 4)

One can do an internet search on “does technical analysis work” and find lots of discussion on the topic.

JA wrote:

     > …I know if someone discovers a profitable strategy he won’t share
     > it… I was asking about “public and very common strategies using
     > TA,” like RSI, Fibonacci etc, because if they work, why aren’t a
     > lot of bots out there making money really easy with that? And my
     > comment about people selling courses is because it confuses me
     > when I see people I trust telling me they use those techniques
     > with good results. How is that possible? Do you think they work?

CF responded:

     > ok dude. you know the “public and very common strategies like
     > RSI, Fibonacci etc.” Those are absolutely total trash. Like: a joke,
     > just a total joke. It’s quite confusing to me that you seem to be
     > saying “many people think those work…” If you ask 1000 working
     > daytraders… they will just smile. Those things are equivalent to
     > the “lose weight!” systems you see sold on informercials you know?
     >
     > With regard to people telling you they use those techniques with
     > good results, those people are: liars. Even if it’s your brother
     > or something, non-working traders often get really confused, sort
     > of exaggerating their own trade results for the better! [7]

Not to be lost on the humor (remember back to [6]! The internet parlance “ROFL” comes to mind right now) is this claim that the standard indicators commonly discussed as the basics of TA do not work.

AJ writes:

     > …any developer can program a bot to trade using TA… and there
     > are a lot of bots out there, and none of them are working. I did
     > a lot of backtesting myself using multiple strategies and none
     > of them work long term… do you really think there is some bot
     > out there that can make a good profit through automated trading
     > and is actually being sold?? Yeah sure, so I coded a bot to make
     > millions when I’m sleeping and I’m publishing it as open source
     > or selling it for $500. Just name ONE that makes guaranteed
     > profit. [8]

He absolutely may be right about this!

On another note, I’m not at all convinced that he knows “none of them are working.” I’m not convinced he’s ever purchased/leased a single bot to try for himself. I’m not convinced he has had real conversation with [credible] others who have. He may be one to spend lots of time in the forums and read what others (also potentially with limited experience like himself) have to say. Back from [7], does anybody know 1,000 working daytraders?” Lots of people say lots of things. We have to evaluate the source, too, and assess what we really don’t (and what they can’t) know.

Again, AJ makes some really good points to consider. As mentioned in the fifth paragraph here, I’ve just started testing multiple strategies over the long term. None have really worked thus far.

To be continued next time.

Does Any Technical Analysis Work? (Part 3)

Today I want to continue discussing some other internet opinions I’ve found about whether TA can actually work.

     > There are a lot of people giving signals to buy or sell based on some
     > indicator or price pattern. There are a lot of people selling courses
     > about how to make profit trading using these well known strategies.
     > And I don’t mean a really… [obscure and esoteric genius strategy]…
     > I mean all these Fib retracements, RSI, MA, etc. I can’t understand why
     > those strategies exist. They are public and they are easy to implement
     > with a bot, so they cannot work right?
     >
     > No you’re not missing anything, if it worked it wouldn’t be on sale.
     > But that’s not a wholesale indictment of TA. [5]

Lots and lots of empty claims exist out there with very little supporting data. All this is to say we need to generate the data ourselves. We need to test everything else run the risk of being duped by something that sounds good and is marketed well.

A “bot,” by the way, is a computer executing algorithmic trading code.

On one forum, I saw someone repeat my observation given in the second paragraph of the above-linked post. Here is another’s response to that:

     > You must be joking man, there are a lot of people selling books on
     > how to lose weight! Good grief! [6]

Made me laugh!

Not only is this a great analogy, though, I suspect it may be true. Judging by how many diets have crossed the screens and shelves over the years, how many can really be said to work? Different diets work for different people here and there, but most diets probably have a low success rate overall. The same is probably true for TA because emotionless systems are very hard to maintain through times of famine and decline. Unless someone has done thorough trading system development, fear will probably own the day forcing said trader to sit alone on the sidelines licking psychological wounds from locked-in losses.

I will continue next time.

Does Any Technical Analysis Work? (Part 2)

The initial impressions of trading system development discussed last time begs the question about whether technical analysis (TA) is all hoax.

I did an internet search for “do simple technical indicators work” and found some interesting posts.* Here is the first:

     > There is no blanket strategy of “TA.” No TA gospel definitively says
     > buy/sell when the price crosses the 200-MA. You’re simply looking for some
     > pricing pattern that appears in the chart to influence your decision to buy
     > or sell, but there are literally an infinite number of pricing patterns.
     > Maybe it’s not a 200-MA but a ratio of 200 * (1 minus the index
     > increase over that period). People come up with all sorts of weird
     > algorithms; some people even find one that will work for a bit. Ultimately,
     > it could be anything… [it qualifies as TA] as long as it involves the
     > quoted price relative to some historical metric… [emphasis mine] [1]

This argues certain combinations of TA indicators can be developed into profitable trading strategies. Yay!

This also provides some hope for data mining, which is an approach I will discuss in future posts.

Here’s another take that is similar in nature:

     > You seem to think “TA…” is some fixed, specific thing… there are a
     > hundred different ideas on so-called “TA” and every person who trades
     > argues bitterly about different aspects of charting… everyone who
     > uses one form of charting assumes that every other charting technique
     > is completely stupid. [emphasis mine] [2]

Mention of “hundred” different TA ideas is deceptively small since the actual amount is infinite (see [1] above).

Unfortunately, people posting online engage in name calling, flaming, and trolling. I often see an oozing excess of pride, arrogance, and ego. In the world of statistics and valid trading system development where strategies either pass or fail, I see no reason to get emotional or to passionately defend things. Follow the data and start testing where the data ends.

Out of those commenting online about TA and trading, I wonder what percentage actually has supporting data? Nobody is credible without large sample sizes under their belt and that includes number of strategies tested.

My algorithmic trading journey has just begun with 300 strategies tested. Even were I to have tested 10x that, though:

     > …just because YOU haven’t found one that you think works well enough
     > to rely on… [doesn’t] mean… [others have]. And when people do, they don’t
     > divulge it. If someone had a strategy that worked, it would not be on sale. [3]

Similarly:

     > When people figure something out and it’s vital to their own profitability,
     > they don’t run around sharing it. Why don’t people understand this? It
     > would save a lot of heartaches… [4]

This is a very interesting concept to consider. In other words, don’t expect anything you see, hear, or read to actually work.

Gotta love the smear campaign, too. You can’t say online financial forums lack entertainment!

I’ll continue next time.

* — Online content may or may not be credible. You have to decide for yourself, and this applies to my blog as well.

Does Any Technical Analysis Work? (Part 1)

I went over my second critique of technical analysis (TA) here. My third criticism is that finding a viable TA-based strategy is extremely difficult.

As discussed in this second paragraph, my goal with trading system development is to find viable strategies: not necessarily profitable ones. I will go into more detail about what makes for a viable trading strategy in future posts.

As discussed in the second paragraph here, in order to test strategies I need objective, codable guidelines. Many, but not all, TA-based strategies are this way.

I borrow from Kevin Davey’s approach and define a strategy as a particular code and/or particular time frame and/or particular market. If I take three different codes, for example, and test them on five different markets and two different time frames, then I have studied 3 * 5 * 2 = 30 different strategies.

I have tested nearly 300 strategies on three different markets. I would guess this to be a lot relative to the average trader because most people don’t learn to code, learn to test, or learn to develop strategies. As I discussed in the linked post from the first paragraph, most traders don’t show or provide any data.

Nevertheless, 300 strategies just barely qualifies me as a newbie when it comes to algorithmic trading. I’m not talking about the options work I have been doing for the last several years. I’m talking about my work on futures markets. Thus far, I’ve tested strategies on US equities, on gold, and on crude oil. What has taken me months would take a seasoned quant days (hours?). I am still learning how to code, still finding strategies, and still trying to figure out how I plan to organize all this.

My initial impression thus far is that finding viable trading strategies is really, really difficult.

Many things about the financial industry and trading domain do not surprise me. I’m not surprised by the fraudulent claims. I’m not surprised by the statistical manipulation. The whole debate about whether successful traders actually exist implies not only that something works but also that someone has discovered it. I’ve questioned whether a better way exists somewhere.

In discussing all these topics, I’ve been talking around the issue of viability.

With regard to viability itself, what does surprise me is to fail time after time after time—nearly 300 in all—at my attempt to find it. I have not found any strategies that meet all my criteria. I have not found any strategies that have compelled me to start trading them straight away.

I will continue this discussion next time.

Curve Fitting 101 (Part 4)

Before I move forward with trading system development approaches, I want to give one more example of how to curve fit: increasing strategy complexity.

Here’s a basic strategy (in EasyLanguage):

          Input: len(14), //optimize 2-20 by 3
                    offset(40), //optimize 30-45 by 5
                    pt(500); //optimize 500-2000 by 500

          setprofittarget(pt);

          if percentR(len) < (50 - offset) then sellshort next bar at market;
          if percentR(len) > (50 + offset) then buy next bar at market;

This is a trend-following strategy that will go long (short) when Williams %R is above (below) an extreme value. I am testing extreme %R values of 20 (80), 15 (85), 10 (90), and 5 (95):

Initial_WFO_equity_curve_(4-20-20)

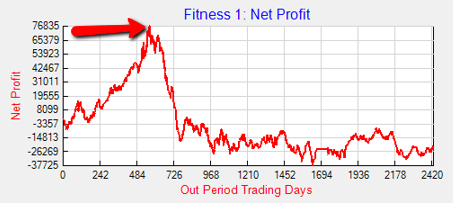
Notice how the strategy performed exceedingly well until the arrow (~500 days in). After that, equity took a precipitous fall and lingered in the doldrums for the remainder of the backtest.

I can improve this by increasing strategy complexity. At the arrow, I will flip from trend following to mean reversion:

          if percentR(len) < (50 - offset) then buy next bar at market;
          if percentR(len) > (50 + offset) then sellshort next bar at market;

After adding a rule, I can look at the equity curve again. Where I see the beginning of another large drawdown, I will add a subsequent rule to flip back to trend following. I can then look at the equity curve again. Where I see the beginning of another large drawdown, I will add a subsequent rule to flip to mean reversion. Rinse and repeat a few times!

With first four lines of code unchanged, here’s what I ended up with:

          If date <= ELDate(11,01,2011) then begin
               if percentR(len) < (50 - offset) then sellshort next bar at market;
               if percentR(len) > (50 + offset) then buy next bar at market;
          end;

          If date > ELDate(11,01,2011) and date < ELDate(08,14,2012) then begin
               if percentR(len) < (50 - offset) then buy next bar at market;
               if percentR(len) > (50 + offset) then sellshort next bar at market;
          end;

          If date >= ELDate(08,14,2012) and date < ELDate(02,20,2013) then begin
               if percentR(len) < (50 - offset) then sellshort next bar at market;
               if percentR(len) > (50 + offset) then buy next bar at market;
          end;

          If date >= ELDate(02,20,2013) and date < ELDate(02,11,2014) then begin
               if percentR(len) < (50 - offset) then buy next bar at market;
               if percentR(len) > (50 + offset) then sellshort next bar at market;
          end;

          If date >= ELDate(02,11,2014) and date < ELDate(12,03,2015) then begin
               if percentR(len) < (50 - offset) then sellshort next bar at market;
               if percentR(len) > (50 + offset) then buy next bar at market;
          end;

          If date >= ELDate(12,03,2015) and date < ELDate(09,29,2016) then begin
               if percentR(len) < (50 - offset) then buy next bar at market;
               if percentR(len) > (50 + offset) then sellshort next bar at market;
          end;

          If date >= ELDate(09,29,2016) and date < ELDate(01,24,2018) then begin
               if percentR(len) < (50 - offset) then sellshort next bar at market;
               if percentR(len) > (50 + offset) then buy next bar at market;
          end;

          If date >= ELDate(01,24,2018) then begin
               if percentR(len) < (50 - offset) then buy next bar at market;
               if percentR(len) > (50 + offset) then sellshort next bar at market;
          end;

I increased the number of rules in this strategy from one to eight. The rules couple date ranges with a mean-reversion/trend-following switch.

This is some of the most blatant curve-fitting possible. I’ve used nothing but hindsight, which we know is invalid as a system development technique (see fourth paragraph). Also, recall in Part 2 where I chose a specific parameter value (VIX < 35)? With that approach, I still have to settle for whatever equity curve results. Here, every rule I add directly manipulates the equity curve in whatever direction I so choose.

This is also the epitome of curve fitting because the rules refer to historical date ranges that don’t even exist in the future. Doing so is criminal indeed:

Curve-fit WFO equity curve (4-20-20)

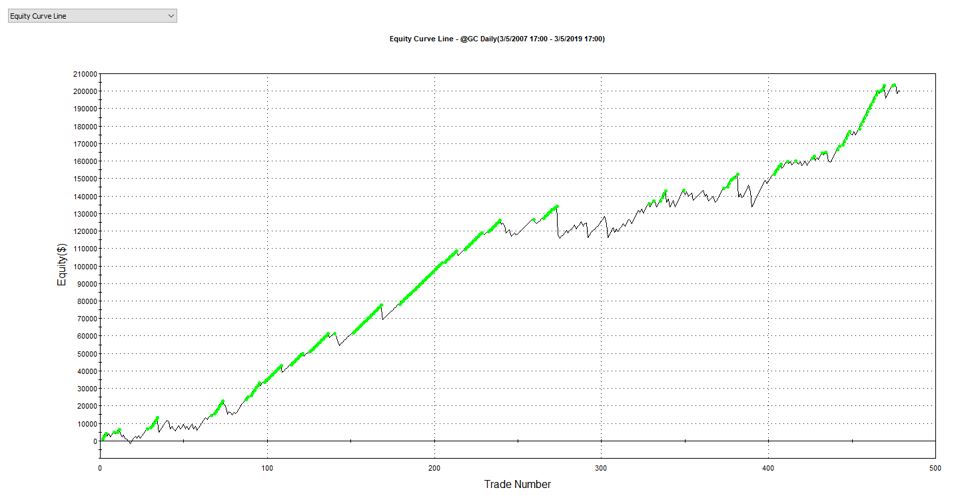
This has 78% winners on 479 trades, a profit factor of 1.71, and trades nearly even with regard to long and short positions (with short trade profit factor of 1.55). Slippage and commissions are included.

The more complicated the strategy, the more beautiful the equity curves. Just remember the more beautiful the equity curve, the less likely it is to be fit to signal rather than noise.

Today’s result is totally, utterly, and absolutely curve-fit. Can’t trade that, folks: no way, no how.

Curve Fitting 101 (Part 3)

Last time, I discussed how specific trade rules may result in curve fitting.

One way to avoid this is to use optimization to explore the surrounding parameter space. When applied as discussed in Part 1, optimization is a bad word. Testing all variable combinations in this manner, however, can be useful as I discussed in paragraphs 4-5 here. Borrowing from this post, look at the following visual:

Spiky Optimization (6-14-16)

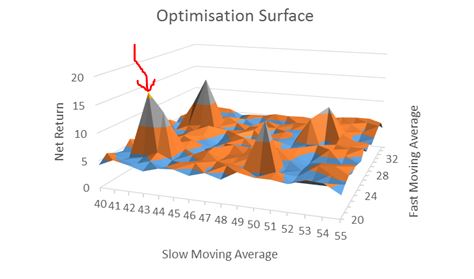
This is a three-dimensional plot with performance (net return) on the z-axis. An optimization may pick the highlighted (red arrow) peak as the best, but if it’s surrounded by losers then the results are probably more fluke (lucky) than due to signal being identified. I would feel much more confident trading a strategy in the middle of a high plateau region where I can choose variables knowing if I am a little off to either side, then I may still have a good chance for good future performance.

Do not use optimization only to choose the best; use optimization as a tool to explore the surrounding parameter space. Test all combinations and survey the landscape. Spikes are bad and high plateau regions are good. The objective is to assess the probability that good performance is not just a matter of random chance.

A standard optimization tests all variable combinations, which are called iterations. Looking back at the plot above, the iterations are ordered pairs along the xy-plane. The total iterations to be tested in a standard (exhaustive) optimization is the product of the number of values each variable can take. The Part 1 strategy had nine iterations: 20 – 100 by 10. Suppose I wanted to add an m-day exit and test exits between 3 – 21 days by an increment of three. Now I have a total of 9 * 7 = 63 iterations to test. If I also add a momentum rule and optimize momentum lookback from 10 – 30 by four, for example, then I have a total of 9 * 7 * 6 = 378 iterations. You can see how fast the iterations add up (especially if I increment by one or two instead of five or 10). This can dramatically impact computer (or especially manual: UGH!) processing time.

Going back to the Part 2 example, if I wanted to incorporate a VIX filter, then I should test different values rather than looking at just 35 (e.g. 20-50 by increments of three) to survey the surrounding parameter space.

Next time, I will discuss one final curve-fitting method.

Curve Fitting 101 (Part 2)

In the last post, I gave examples of how optimization could be used to manufacturer an investment newsletter scam. Today, I want to get back to trading system development and give another example of how curve fitting can generate deceptive results.

Also known as overfitting, curve fitting is tailoring a trading strategy to better match historical noise than persistent signal. The strategy may look great in backtesting, but it is unlikely to look good when applied to future data because noise is random.

Besides optimization (see Part 1), a second way to curve fit is to use specific parameter values. Consider a simple strategy that buys pullbacks (in TradeStation’s EasyLanguage):

          If C = lowest(C,10) then buy next bar at market;
          If barssinceentry >= 3 then sell next bar at market;

This strategy buys after the lowest close in 10 days (bars) and sells after the position has been open for at least three days.

Suppose this strategy suffered its maximum drawdown on the VIX spike over 35 in the 2008-9 financial crisis. Let’s add another rule by changing the first line to:

           If C = lowest(C,10) and close of data2 < 35 then buy next bar at market;

Now, the long entry will occur when close is the lowest close in 10 days and when VIX is less than 35. This can improve the equity curve by avoiding a losing trade(s) and going flat in an area that previously experienced drawdown.

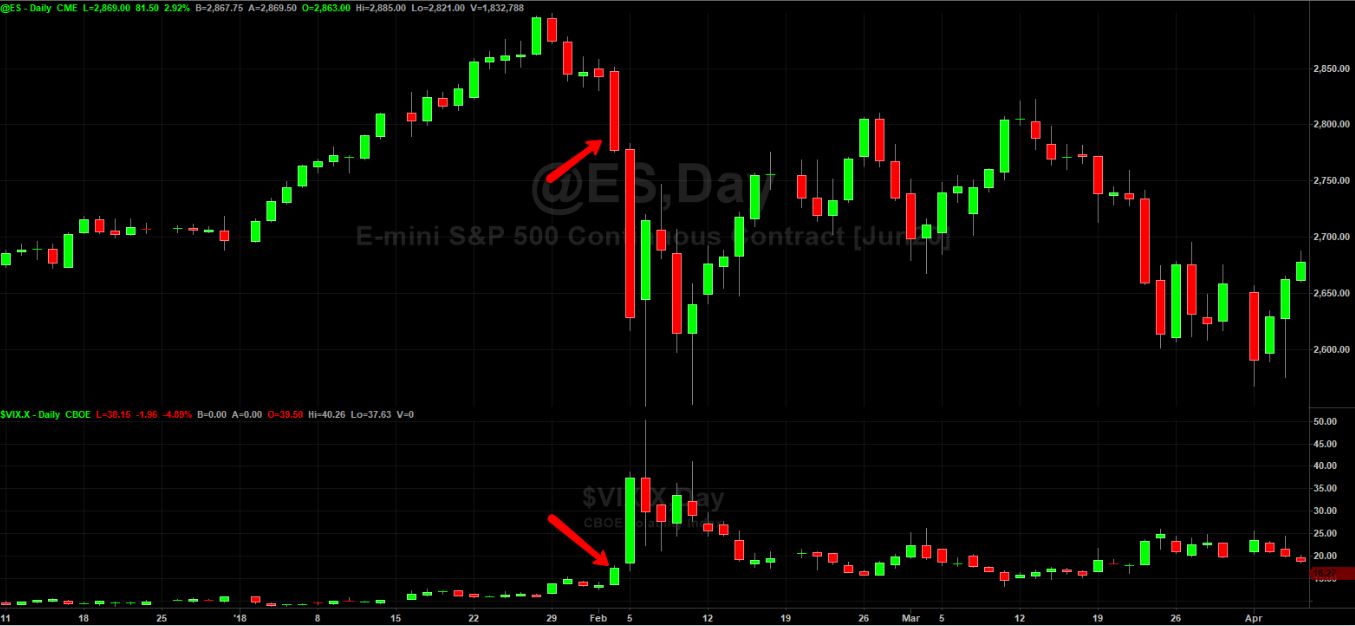
The problem here is adding a specific rule to fix a particular past occurrence. It’s like applying a single Band-Aid. A similar event capable of causing significant damage may occur in the future, but the filter may not be effective since we based it on a sample size of 1. Look what happened in February 2018:

Curve fit chart (4-18-20)

The arrows point to February 2 when ES had a big drop of 2.3% and VIX spiked to 17.31. That was a big move with VIX closing at its highest level in nearly 15 months (11/8/16), but it did not trigger our filter (17.31 < 35). The curve-fit strategy would enter the pullback just in time for February 5, 2018, when the market fell 5.4% and VIX spiked to 37.32. The VIX filter would now be active: one bar too late to serve its purpose. I analyzed a trading strategy that applied this rule here. My curve-fitting comments are in the seventh paragraph.

I will continue the discussion next time.