Testing the Randomized OOS (Part 2)
Posted by Mark on January 30, 2019 at 06:35 | Last modified: June 15, 2020 06:36I described the Randomized OOS in intricate detail last time. Today I want to proceed with a method to validate Randomized OOS as a stress test.
I had some confusion in determining how to do this study. To validate the Noise Test, I preselected winning versus losing strategies as my independent variable. My dependent variables (DVs) were features the software developers suggested as [predictive] test metrics (DV #1 and DV #2 from Part 1). I ran statistical analyses on nominal data (winning or losing OOS performance, all above zero or not, Top or Mid) to identify significant relationships.
I thought the clearest way to do a similar validation of Randomized OOS would be to study a large sample size of strategies that score in various categories on DV #1 and DV #2. Statistical analysis could then be done to determine potential correlation with future performance (perhaps as defined by nominal profitability: yes or no).
This would be a more complicated study than my Noise Test validation. I would need to do subsequent testing one at a time, which would be very time consuming for 150+ strategies. I would also need to shorten the IS + OOS backtesting period (e.g. from 12 years to 8-9?) to preserve ample data for getting a reliable read on subsequent performance. I don’t believe 5-10 trades are sufficient for the latter.*
Because Randomized OOS provides similar data for IS/OOS periods, I thought an available shortcut might be to study IS and look for correlation to OOS. My first attempt involved selection of best and worst strategies and scoring the OOS graphs.
In contrast to the Noise Test validation study, two things must be understood here about “best” and “worst.” First, the software is obviously designed to build profitable strategies and it does so based on IS performance. Second, a corollary to this is that even those strategies at the bottom of the results list are still going to be winners (see fifth paragraph here to see that the worst Noise Test validation strategies were OOS losers). I still thought the absolute performance difference from top to bottom would be large enough to see significant difference in the metrics.
I will continue next time.
* — I could also vary the time periods to get a larger sample size. For example, I can backtest from
2007-2016 and analyze 2017-2019 for performance. I can also backtest from 2010-2019 and
analyze 2007-2009 for performance. The only stipulation is that the backtesting period be
continuous because I cannot enter a split time interval into the software. If I shorten the
backtesting period even further, then I would have more permutations available within the 12
years of total data as rolling periods become available.
Testing the Randomized OOS (Part 1)
Posted by Mark on January 27, 2019 at 06:28 | Last modified: June 14, 2020 08:00I previously blogged about validating the Noise Test on my current trading system development platform. Another such stress test is called Randomized OOS (out of sample) and today I begin discussion of a study to validate that.
While many logical ideas in Finance are marketable, I have found most to be unactionable. The process of determining whether a test has predictive value or whether a trading strategy is viable is what I call validation. If I cannot validate Randomized OOS then I don’t want to waste my time using it as part of my screening process.
The software developers have taught us a bit about the Randomized OOS in a training video. Here’s what they have to say:
- Perhaps our strategy passed the OOS portion because the OOS market environment was favorable for our strategy.
- This test randomly chunks together data until the total amount reaches the specified percentage designated for OOS.
- The strategy is then retested on the new in-sample (IS) and OOS periods to generate a simulated equity curve.
- The previous step is repeated 1,000 times.
- Note where the original backtested equity curve is positioned within the distribution [my dependent variable (DV) #1].
- Watch for cases where all OOS results are profitable [my DV #2]; this should foster more confidence that the original OOS period is truly profitable because no matter how the periods are scrambled, OOS performance will likely be positive.
I want to further explain the second bullet point. Suppose I want 40% of the data to be reserved for OOS testing. The 40% can come at the beginning or at the end. The 40% can be in the middle. I can have 20% at the beginning and 20% at the end. I can space out 10% four times intermittently throughout. I can theoretically permute the data an infinite number of times to come up with different sequences, which is how I get distributions of simulated IS and OOS equity curves.
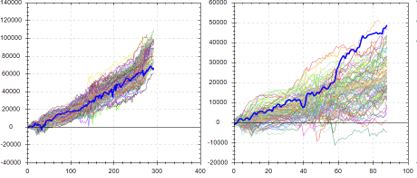
Here are a couple examples from the software developers with the left and right graphs being IS and OOS, respectively, and the bold, blue line as the original backtested equity curve:
This suggests the backtested OOS performance is about as good as it could possibly be. Were the data ordered any other way, performance of the strategy would likely be worse: an ominous implication.
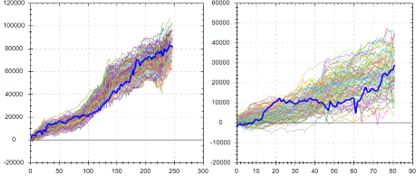
Contrast to this example:
Here, backtested OOS performance falls in the middle (rather than top) of the simulated distribution. This suggests backtested OOS performance is “fair” because ~50% of the data permutations have it better while ~50% have it worse. This is considered more repeatable or robust. In the previous example, ~100% of the data permutations gave rise to worse performance.
The third possibility locates the original equity curve near the bottom of the simulated distribution.* This would occur in a case where the original OOS period is extremely unfavorable for the strategy—perhaps due to improbable bad luck. Discarding the strategy for performance reasons alone may not be the best choice in this instance.
I will continue next time.
* — I am less likely to see this because the first thing I typically do is look at
IS + OOS equity curves and readily discard those that don’t look good.
Questioning Butterflies
Posted by Mark on September 18, 2017 at 06:26 | Last modified: June 10, 2017 07:31I feel like I could go on with BIBF discussion for quite some time but I think it may be time to change course altogether.
In the final paragraph of my last post, I laid out a solid plan for future research directions. I now have five degrees of freedom, which are multiplicative in trading system development. This could easily take years of manual backtesting.
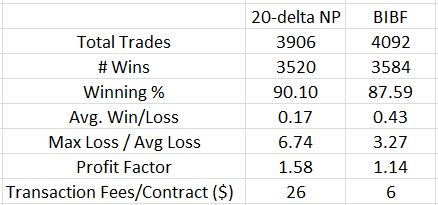
I find it hard to accept this significant time commitment given the disappointing first impression for butterflies when compared to naked puts (NP). Consider NPs versus the BIBF:
These numbers somewhat confirm my NP worries about the potential for large downside loss. Max Loss / Avg Loss is 2.1x greater for the BIBF. Average win/loss metric is 2.52x greater for the BIBF. In both cases, advantage: butterflies.
But to get the BIBF looking this good, I had to significantly reduce transaction fees. I question whether I can reliably get these trades executed for so little slippage on each side. If not then up to 319 of the 4092 backtested trades [with MAE = 0] are at risk of going unfilled, which means the backtested performance is artificially high.
The BIBF performance is hardly compelling. A profit factor of 1.14 is just slightly into the profitable range. 1.58, for the NPs, is much more to my liking especially being saddled with a healthy amount of transaction fees at $26/contract. Whereas 1.14 may be optimistic, 1.58 may be pessimistic.
One other thing to notice is the much larger commission cost for butterflies over NPs. Trading NPs is dirt cheap: one or two commissions per position. Trading butterflies involves at least six commissions per position and possibly 7-8. All that and I get less profit? This is a soft poke in the eye.
If the real challenge is to limit potential for catastrophic downside risk then perhaps the better way to proceed is with put spreads or put diagonals.
Another idea is to consider a bearish butterfly as a hedge for trading NPs since the latter will be hurt by a down market whereas the former could benefit. I’d be interested to see how a bearish butterfly performs compared to this bullish one but I would be inclined to implement fixed width, which would mean two additional lengthy backtests.
Categories: System Development | Comments (0) | PermalinkThe Pseudoscience of Trading System Development (Part 5)
Posted by Mark on June 28, 2016 at 07:48 | Last modified: May 10, 2016 12:29My last critique for Perry Kaufman’s system is its excessive complexity.
I believe the parameter space must be explored for each and every system parameter. For this reason, I disagree with Kaufman’s claim of a robust trading system. He applied one parameter set to multiple markets but I don’t believe successful backtesting on multiple markets is any substitute for studying the parameter space to make sure it’s not fluke. Besides, I don’t care if it works on multiple markets as long as it works on the market I want to trade.
When exploring each parameter space, the analysis can quickly get very complicated. I discussed this in a 2012 blog post. In Evaluation and Optimization of Trading Strategies (2008), Robert Pardo wrote:
> Once optimization space exceeds two dimensions
> (indicators), the examination of results ranges
> from difficult to impossible.
To understand this, refer back to the graphic I pasted in Part 2. That is a three-dimensional graph with the subjective function occupying one dimension.
For a three-parameter system, I can barely begin to imagine a four-dimensional graph. The best I can do is to imagine a three dimensional graph moving through time. I’m not sure how I would evaluate that for “spike” or “plateau” regions, though: terms that refer to two dimensional drawings.
For a better visualization of what I’m trying to say here, this video shines light on Pardo’s words “difficult to impossible” (and if you can help me spatially understand the video then please e-mail).
Oh by the way, Kaufman’s system has seven parameters, which would require an eight-dimensional graph.
At the risk of repetition, I will say once again that Kaufman is not wrong. Just because it doesn’t work for me does not mean it is wrong for him.
And that is why I have pseudoscience in the title of this blog series. That is also why I use the term subjective instead of objective function. A true science would be right for everyone. Clearly this is not. It’s wrong for me and it should be wrong for you but it is never wrong for the individual or group who does the hard work to come up with and develop it.
Categories: System Development | Comments (1) | PermalinkThe Pseudoscience of Trading System Development (Part 4)
Posted by Mark on June 23, 2016 at 06:51 | Last modified: May 8, 2016 10:42Today I want to continue through my e-mail correspondence with Perry Kaufman about his April article in Modern Trader.
Kaufman e-mailed:
> are not particularly sensitive to changes
> between 90 and 100 threshold levels, so I
> pick 95… Had it done well at 95 and badly
> at 90, I would have junked the program.
Junking the system and not writing an article on it would be the responsible thing to do. He can claim to be that person of upright morals but it doesn’t mean I should trade his system without doing the complete validation myself. I’m quite sure that even he would agree with this.
In response to my comments, Kaufman sent a final e-mail:
> I appreciate your tenacity in pursuing this…
> I’m simply providing what I think is the basic
> structure for something valuable. I had no
> intention of proving its validity scientifically…
> I’m interested in the ideas and I will then
> always validate them before using them. For
> me, the ideas are worth everything.
Kaufman essentially absolves himself of any responsibility here. He did nothing wrong in the article but I, as a reader, would be wrong to interpret it as anything more than a collection of ideas. It may look like a robust trading system but I have much work to do if I am to validate it and adopt it as my own.
What can give me the confidence required to stick with a trading system is the hard work summarized by the article but not the article itself. If the sweat labor is not mine then I am more likely to close up shop and lock in maximum losses when the market turns against me because paranoia, doubt, and worry will come home to roost. When I do the hard work myself (or with a team of others to proof my work) then I have a deeper understanding of context and limitations, which is what gives me the confidence necessary to stick with system guidelines.
If this sounds anything like discretionary trading then it should because I have written about both in the same context. It’s also the same reason why I recommend complete avoidance of black box trading systems.
Categories: System Development | Comments (0) | PermalinkThe Pseudoscience of Trading System Development (Part 3)
Posted by Mark on June 20, 2016 at 06:36 | Last modified: February 9, 2017 09:57I left off explaining how Perry Kaufman did not select the parameter set at random for his April article in Modern Trader. This may be okay for him but it should never be okay for anyone else.
The primary objective of trading system development is to give each of us the confidence required to stick with the system we are trading. I could never trade Kaufman’s system because I find the article to be incomplete.
In an e-mail exchange, Kaufman wrote:
> Much of this still comes down to experience and
> in some ways that experience lets me pull values
> for various parameters that work. Even I can say
> that’s a form of overfitting.
Kaufman’s personal experience is acceptable license for him to take shortcuts. He admits this may be overfitting [to others] but he doesn’t want to “reinvent the wheel.”
> But the dynamics of how some parameters work
> with others, and with results, is well-known.
Appealing to my own common sense and what is conventional wisdom, Kaufman is now saying that I don’t need to reinvent the wheel either. I disagree because I don’t have nearly enough system development experience to take any shortcuts.
> My goal is to have enough trades to be
> statistically significant (if possible),
> so I’m going to discard the thresholds
> that are far away.
I love Kaufman’s reference to inferential statistics. I think the trading enterprise needs more of this.
> Also, my experience is that momentum indicators…
Another appeal to his personal experience reminds me that while this may be good enough for him as one trading his own system, it should never be good enough for others. I feel strongly that when it comes to finance, the moment I decide to take someone’s word for it is the moment they will have a bridge to sell me that doesn’t belong to them in the first place.
Money invokes fear and greed: two of the strongest emotions/sins in all of human nature. They are strong motivators that provide strong temptation. I did a whole mini-series on fraud and while I’m not accusing Kaufman of any wrongdoing whatsoever, each of us has a responsibility to watch our own backs.
I will continue next time.
Categories: System Development | Comments (1) | PermalinkRandomization: Not the Silver Bullet
Posted by Mark on June 17, 2016 at 06:36 | Last modified: May 29, 2021 08:53Random samples are often a research requirement but I believe trading system development requires something more.
Deborah J. Rumsey, author of Statistics for Dummies (2011), writes:
> How do you select a statistical sample in a way
> that avoids bias? The key word is random. A
> random sample is a sample selected by equal
> opportunity; that is, every possible sample of
> the same size as yours had an equal chance to
> be selected from the population. What random
> really means is that no subset of the
> population is favored in or excluded from the
> selection process.
>
> Non-random (in other words bad) samples are
> samples that were selected in such a way that
> some type of favoritism and/or automatic
> exclusion of a part of the population was
> involved, whether intentional or not.
Randomized controlled trials have been said to be the “gold standard” in biomedical research but I do not believe randomization is good enough for trading system development. Yes it would be good to avoid selection bias but this is not sufficient. I wrote about this here. The only way I can know my results are not fluke is to optimize and test the surrounding parameter space. Evaluating the surface will reveal whether a random parameter set corresponds to a spike peak or the middle of a plateau.
This perspective on randomization concurs with my last post. Perry Kaufman selected one and only one parameter set to test and for that reason I took him to task.
As Rumsey’s quote suggests, statistical bias is never a good thing. E-mail correspondence suggests Kaufman did not pick any of the values in his particular parameter set at random. He selected them based on his experience and knowledge of market tendencies. My gut response to this is “just do the work and test them all.”
While this may or may not be feasible depending on how multivariate the system, it brings to light the main objective of trading system development. I will discuss this next time.
Categories: System Development | Comments (0) | PermalinkThe Pseudoscience of Trading System Development (Part 2)
Posted by Mark on June 14, 2016 at 06:15 | Last modified: May 4, 2016 10:01Last time I outlined a trading system covered by Perry Kaufman and offered some cursory critique. Today I want to cut deeper and attack the heart of his April Modern Trader article.
With this trading system, Kaufman presents a complex, multivariate set of conditions. He includes an A-period simple moving average, a B-period stochastic indicator, a C (D) stochastic entry (exit) threshold, an E (F) threshold for annualized volatility entry (exit), and a G-period annualized volatility. Kaufman has simplified the presentation by assigning values to each of these parameters and providing results for a single parameter set:
A = 100
B = 14
C = 15
D = 60
E varies by market
F = 5%
G = 20
I believe development of a trading system is an optimization exercise. Optimizing enables me to decrease the likelihood that any acceptable results are fluke by identifying plateau regions greater than a threshold level for my dependent variable (or “subjective function“). Optimization involves searching the parameter space, which by definition cannot mean selecting just one value and testing it. This is what Kaufman has done and herein lies my principal critique.
Kaufman should have defined ranges of parameter values and tested combinations. Maybe he defines A from 50-150 by increments of five (i.e. 50, 55…145, 150), B from 8-20 by increments of two (i.e. 8, 10… 18, 20), etc. The number of total tests to run is the product of the number of possible values for each parameter. If A and B were the only parameters of the trading system then he would have 21 * 7 = 147 runs in this example. The results could be plotted.
Here is what I don’t want to see:
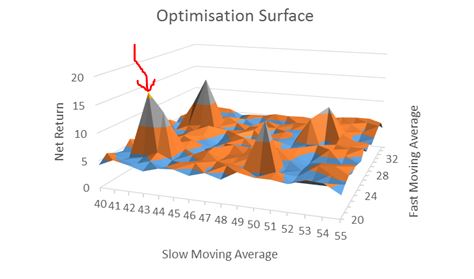
[I found this on the internet so please assume the floor to be some inadequate performance number (e.g. negative)]
A robust trading system would not perform well at particular parameter values but perform poorly with those values slightly changed. This describes a spike area as shown by the red arrow: a chance, or fluke occurrence.
Kaufman claims to have “broad profits” with his system but I cannot possibly know whether his parameter set corresponds to a spike or plateau region because he did not test any others. No matter how impressive it seems, I would never gamble on a spike region with real money. Graphically, I want to see a flat, extensive region that exceeds my performance requirements. To give myself the largest margin of safety I would then select parameter values in the middle of that plateau even if the values I choose do not correspond to the absolute best performance.
Categories: System Development | Comments (1) | PermalinkThe Pseudoscience of Trading System Development (Part 1)
Posted by Mark on June 9, 2016 at 07:11 | Last modified: May 4, 2016 08:14I subscribe to a couple financial magazines that provide good inspiration for blog posts. Today I discuss Perry Kaufman’s article “Rules for Bottom Fishers” in the April issue of Modern Trader.
In this article, Kaufman presents a relatively well-defined trading strategy. Go long when:
1. Closing price < 100-period simple moving average
2. Annualized volatility (over last 20 days) > X% (varies by market)
3. 14-period stochastic < 15
Sell to close when:
1. Annualized volatility < 5%
2. Stochastic (14) > 60
Kaufman provides performance data for 10 different markets. All 10 were profitable on a $100,000 investment from 1998 (or inception). Based on this, he claims “broad profits.” Kaufman concludes with one paragraph about the pros/cons to optimizing, which he did not do. He claims this strategy to be robust as one universal set of parameters.
In the interest of full disclosure, let me recap my history with Perry Kaufman. I have a lot of respect for Kaufman because he has been around the financial world for decades. One of the first books I read when getting serious about trading was his New Trading Systems and Methods (2005). As a bright-eyed and bushy-tailed newbie, I even e-mailed him a few questions in thinking this was truly the path to riches.
Being a bit more educated now, I see things differently.
For starters, here is some critique about what jumps off the page at me after a second read. First, four of the 10 markets are stock indices (QQQ, SPY, IWM, DIA) that I would expect extremely to be highly correlated. “Broad profits” is therefore more narrow. Second, although the trading statistics all appear decent, the sample sizes are very low. Three ETFs have fewer than 10 trades and only two have more than 50 (max 64). Finally, Kaufman provides no drawdown data. Max drawdown may define position sizing and provides good context for risk. I feel this is very important information to provide.
When I first read the article, my critique focused on a different set of ideas. I will discuss that next time.
Categories: System Development | Comments (0) | PermalinkFixed Position Sizing in Trading System Development
Posted by Mark on May 5, 2016 at 06:20 | Last modified: March 24, 2016 12:31I have mentioned the importance of fixed position sizing on multiple occasions. Today I want to present another example.
Here is a table showing performance of five different investing strategies. Which one is the best?
Do you agree with E > D > C > B > A?
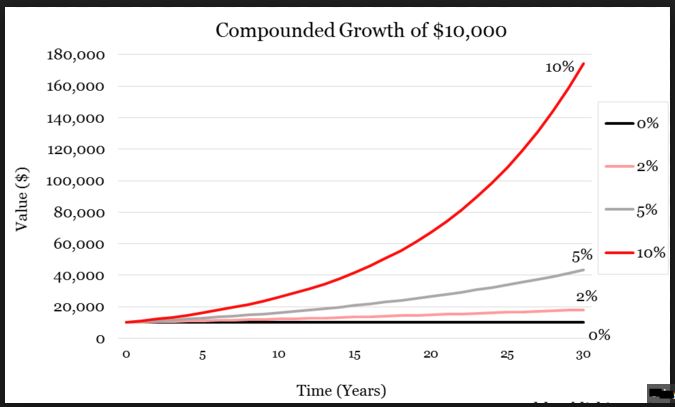
This assumes fixed position sizing. No matter how good or bad the strategy does in any given year, fixed position sizing means I risk the same amount for the following year. This is not typically how longer-term investing is modeled. You’ve probably seen the compound growth curve that so many investing firms and newsletters like to market:
I will not get curves like this by doing the math shown under the “Expected Cumulative Return” column. Beautiful exponential curves are only possible if I remain fully invested. As the account grows, my position size grows. Exponential returns are not a by-product of fixed position sizing.
Following a fully-invested, compound-returns financial plan will generate the following from our five investing strategies:
Now it seems the investment strategies should be ranked D > C > B > E > A. Note how the mighty (E) has fallen! This is the risk of trying to compound returns. Big percentage losses early leave a small amount in the account to grow when the strategy performs well. Big percentage losses late when account equity is at all-time highs have the biggest gross impact.
So which strategy is best?
We must first determine whether fixed or variable position sizing is used to better understand what we are looking at.
One additional column presents some revealing information:
E, the strategy that initially looked best but proved to be rather poor, has by far the highest standard deviation (SD) of returns. SD measures variability of returns. This is why the Sharpe Ratio—a performance measure where higher is better—has SD in the denominator.
In summary, when comparing performance higher average annual returns are better but only to a point. Returns must also be consistent because excess variability can be detrimental. This is why I often study maximum drawdown: the kind of variability capable of keeping me up at night and causing me to bail out of a strategy at the worst possible time.
Categories: System Development | Comments (1) | Permalink