The Naked Put (Part II)
Posted by Mark on March 22, 2012 at 10:53 | Last modified: March 29, 2012 13:56The holy grail of trading could be achieved through booking consistent profit on a daily basis. In my last post on March 20 (http://www.optionfanatic.com/2012/03/20/the-naked-put-part-i/), I described an April 510 naked put trade on AAPL. Today, I want to illustrate that trade by presenting a series of risk graphs.
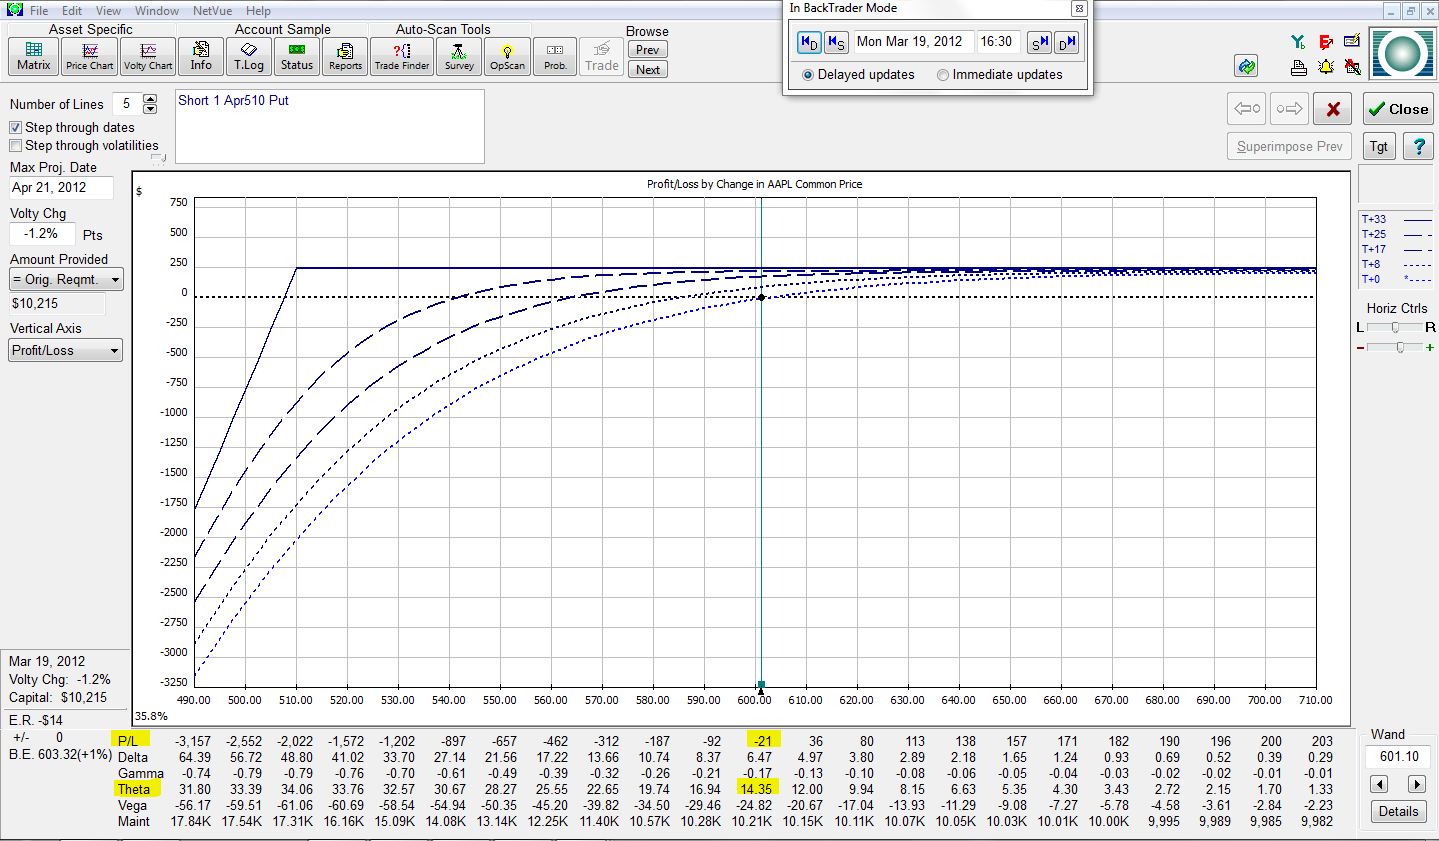
As mentioned, the trade was placed on March 19, with 33 days to April options expiration. At trade inception, the trade looks like this:
The green vertical line is the “wand,” which now sits at AAPL’s current price of 601.10. For the purposes of this analysis, I will assume stock price and volatility (to be described at a later date) always remain constant. The risk graph shows the P/L of the position (y-axis) based on the price of AAPL stock (x-axis). At trade inception, focus on the T+0 curve, which is the lowest dotted curve (also differentiated by a lighter blue color). The yellow highlighting indicates the trade to be currently losing $21 due to transaction costs and to have a theta value of 14.35. The trade will make $14.35/day.
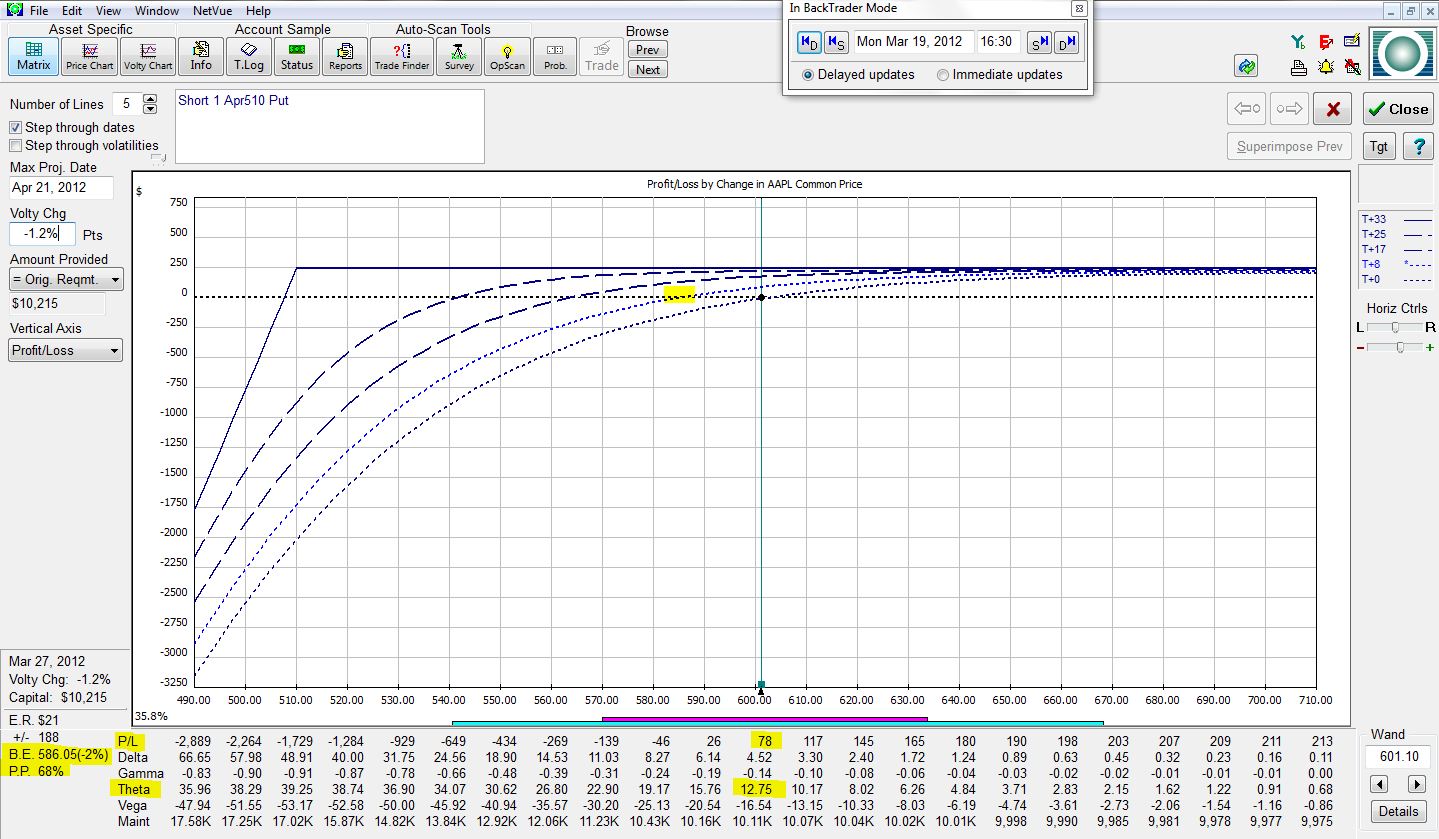
Let’s now fast forward to the next-higher dotted curve, which represents the position eight days into the future:
The P/L is +$78 with a theta value of 12.75. The trade will now make $12.75 per day. The yellow highlighted portion on the dotted curve corresponds with the “B.E.” in the lower left of the risk graph. This shows how far the stock would have to fall (2%) for the trade to be at breakeven (P/L = $0). P.P. is “probability of profit.” Eight days into the future, the risk graph shows this trade to have a 68% chance of being profitable.
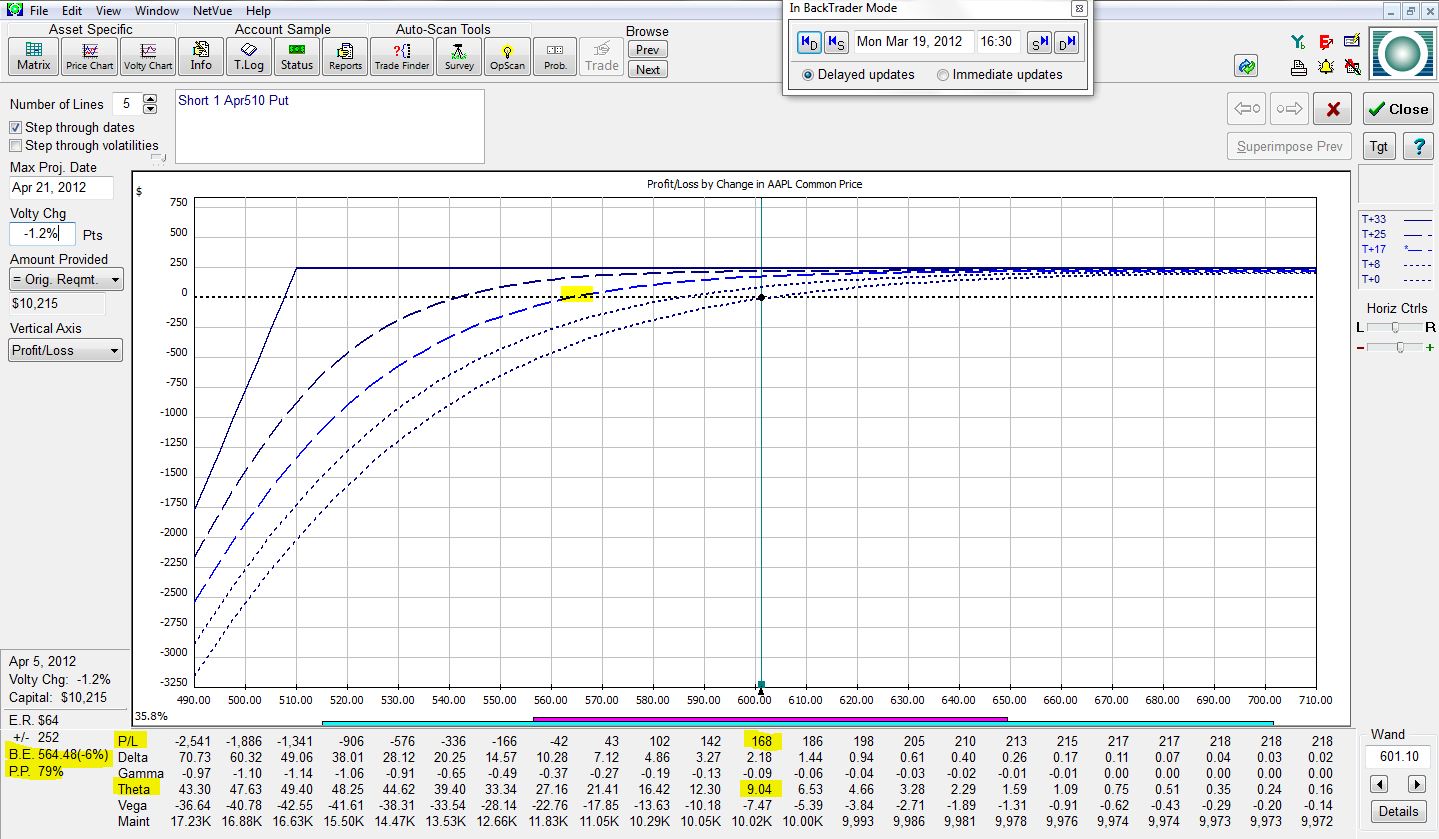
Next, let’s jump nine more days into the future:
The P/L is now +$168 with a theta value of 9.04. The B.E. is 6% below the current market price, which means AAPL stock could drop up to 6% before the profit on this trade evaporates. The trade would have a 79% chance of showing a profit.
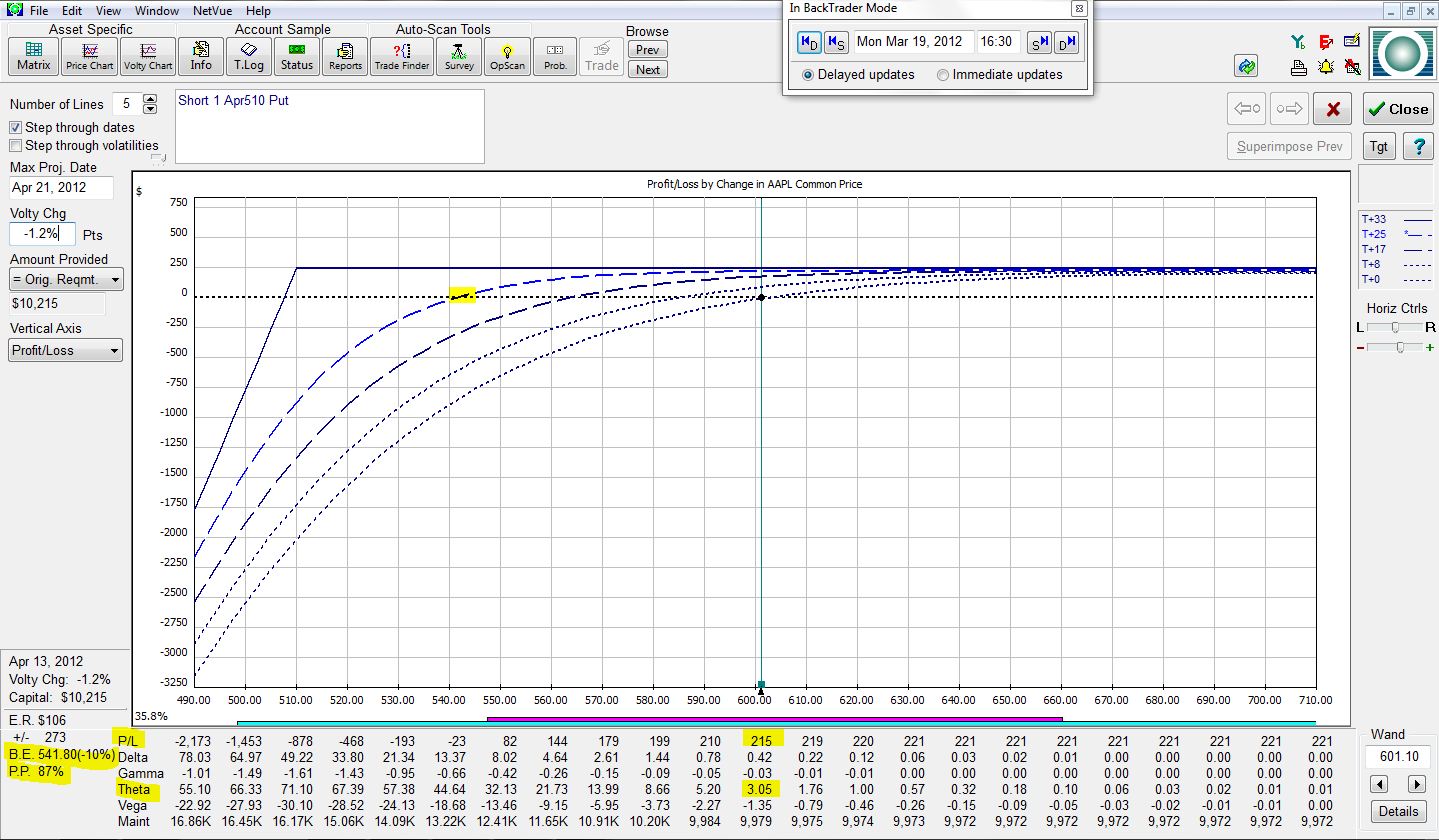
Moving eight days further ahead:
The trade is now up $215 with a theta value of 3.05. AAPL stock could fall up to 10% without this trade showing a loss. The probability of this trade being profitable after 25 days is 87%.
Finally, the risk graph at expiration (eight more days into the future or 33 total days from trade inception) is:
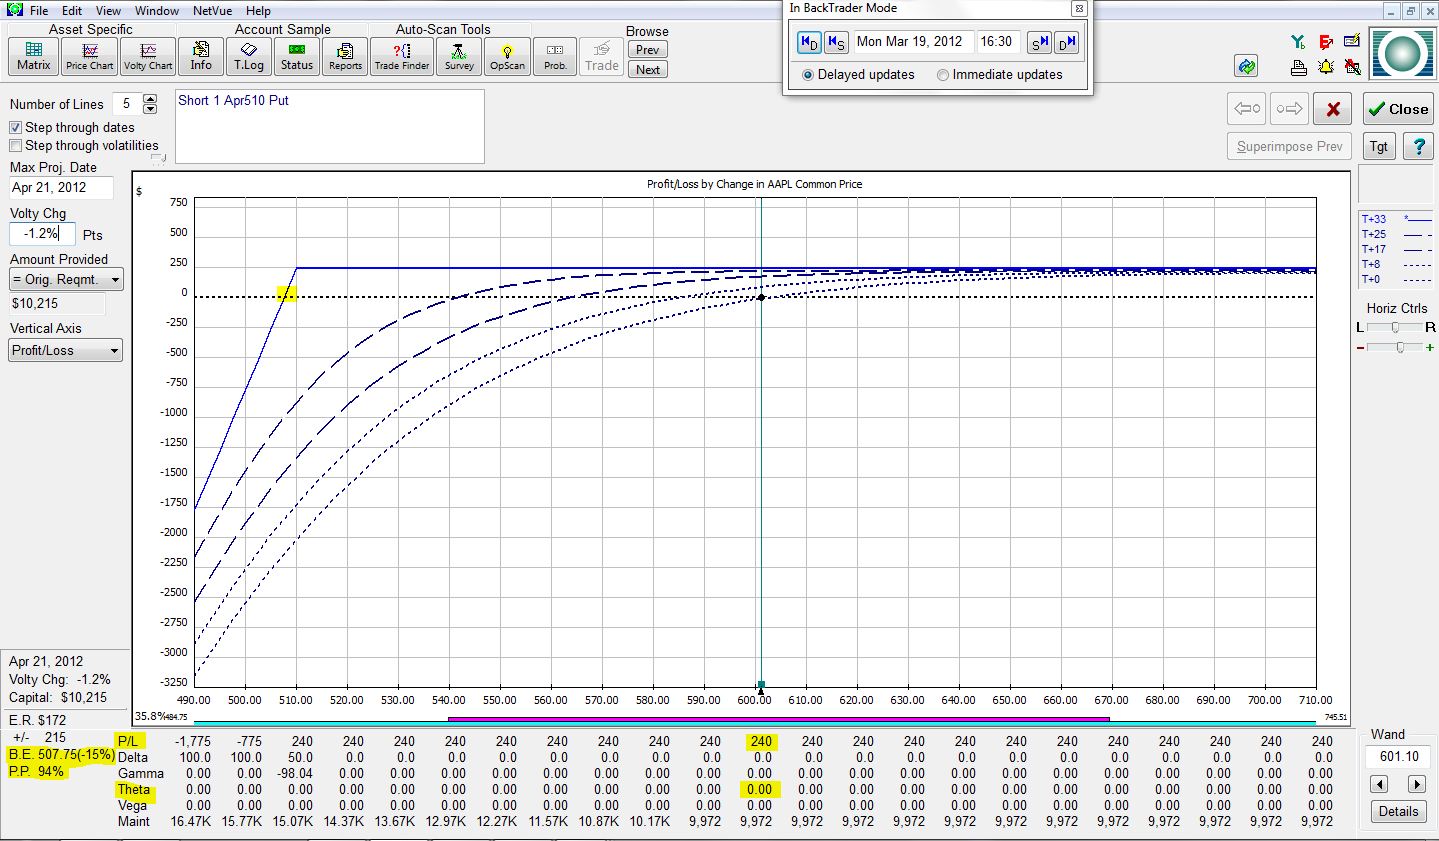
The trade has made the full $240. Theta is now zero since the option has expired. The trade has 15% of downside stock protection and a 94% chance of posting a profit.
Note how theta decreases over time as more and more of the available profit has been made on the trade. In my next post, I will discuss some implications of this observation and go into more detail about the trade.
Tags: income trading, trader education | Categories: Option Trading | Comments (2) | PermalinkThe Naked Put (Part I)
Posted by Mark on March 20, 2012 at 08:08 | Last modified: March 28, 2012 07:43In the quest for consistent trading profits, I have turned to option income trading: the establishment of a positive theta position. Theta is an “option greek” that describes what will happen to your P/L as each day passes. When you establish a positive theta position, you can expect to make daily money from time decay.
In theory, this is best understood by assuming no change in stock price from now until expiration. On March 19, AAPL stock closed at $601.10. I can sell an April 510 put for about $2.40. If AAPL remains at $601 then with the passage of each day, I stand to make about $14. When the option expires worthless in 33 days, the entire $240 will be mine.
Of course, no free lunch exists with option trading [or anything else?]. In exchange for the $14/day, I have taken on the obligation to buy 100 shares of AAPL for $510/share (the “strike price”) on or before April 21. As long as AAPL remains above the strike price, nobody in their right mind would have me buy their shares for $510 each because they could sell on the open market for a higher price. This is why the 510 put would expire worthless.
As with all aspects of trading and investing, option income trading is paired with risk. In future posts, I’ll talk more about this risk, volatility, and different aspects of option trading that I am fanatical about.
Tags: income trading, trader education | Categories: Option Trading | Comments (4) | PermalinkPrevent Huge Portfolio Losses
Posted by Mark on March 14, 2012 at 13:07 | Last modified: March 20, 2012 08:28One key to success in trading and investing is to prevent huge portfolio losses. If you lose 50% of your portfolio, for example, then you have to gain 100% just to get back to even. Off the top of my head, I can think of three ways to limit huge portfolio losses:
1. Diversify
What this really means is to include uncorrelated assets in your portfolio. “Uncorrelated” means prices tend not to move in sync. For example, if one goes up, the other goes sideways or down. Alternatively, if one goes way down then the other goes up, sideways, or down a little.
The danger of diversification is that in extreme circumstances correlation can go to 1, which means everything moves together. You could be invested in markets that had historically been uncorrelated but when the crash hits, everything goes down. We saw this in fall 2008 when gold, bonds, and the stock markets all fell precipitously for a while.
2. Position size to limit total exposure.
If you are only 10% invested then the most you could ever lose if that asset (e.g. stock) goes to zero is 10%. The remaining 90% of your portfolio would be in cash.
3. Buy puts
Put options profit when their underlying markets fall. Options were originally created to serve as insurance and this is exactly what long puts can do.
Other ways of achieving this goal are to short markets or to buy inverse ETFs.
Tags: survival | Categories: Money Management, Option Trading | Comments (0) | Permalink