Covered Calls and Cash Secured Puts (Part 3)
Posted by Mark on October 22, 2013 at 06:03 | Last modified: January 9, 2014 11:49In this blog series, I’m detailing different aspects of the CC/CSP trade in an attempt to develop some trading guidelines for future use. Today I want to explain why a CSP is less risky than owning stock outright.
Yes a CSP, or naked put, is less risky than owning stock. Why this is counterintuitive to many is something I will discuss in a future post. The first step to understanding it is to recall that a CSP and CC are synthetically equivalent.
Saying that a CC is less risky than owning stock outright may feel more comfortable because CCs have long been touted as a “conservative [option] strategy.”
Risk management is about limiting potential loss. With a CC, I buy the stock and sell a call. Selling the call puts money in my pocket. The CC is therefore cheaper than the stock. If the stock goes to zero then I lose less money with the CC than I do the stock because I already put money in my pocket. The CC is therefore less risky than the stock because I cannot lose as much money. The CSP is also less risky than the stock for the same reason.
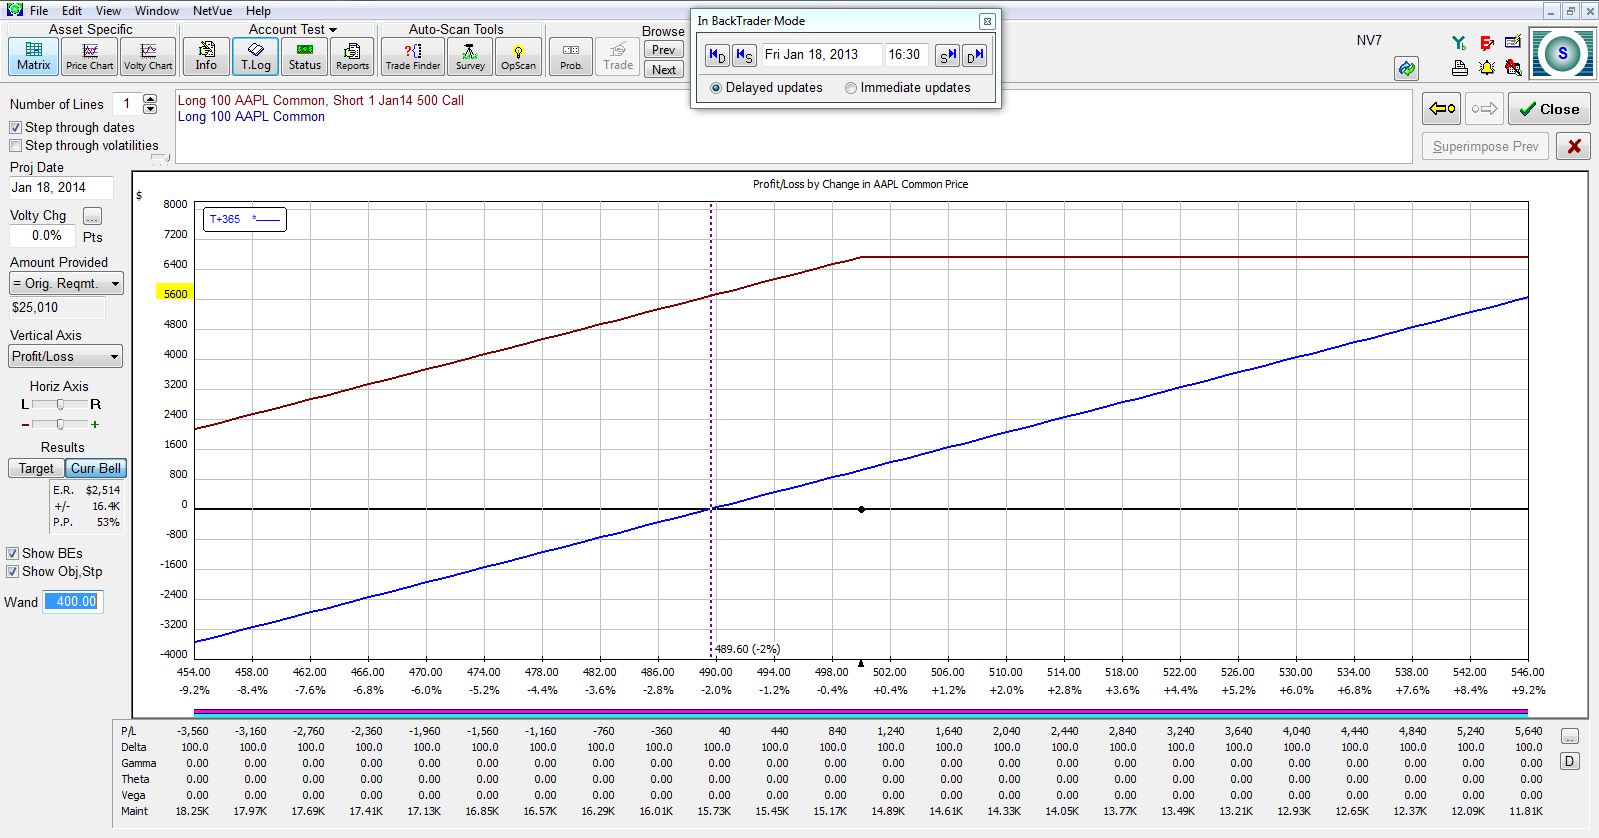
The following graph plots the PnL of AAPL stock (blue line) and CC position (purple line) 365 days after trade inception. The option expires on that day. Stock dividends ($1,040) are included:
The vertical, dotted line shows breakeven for the stock position if the stock price falls. At this zero profit level, the CC shows a profit of $5,600, which is the profit from selling the call at trade inception. The stock is more risky than the CC.
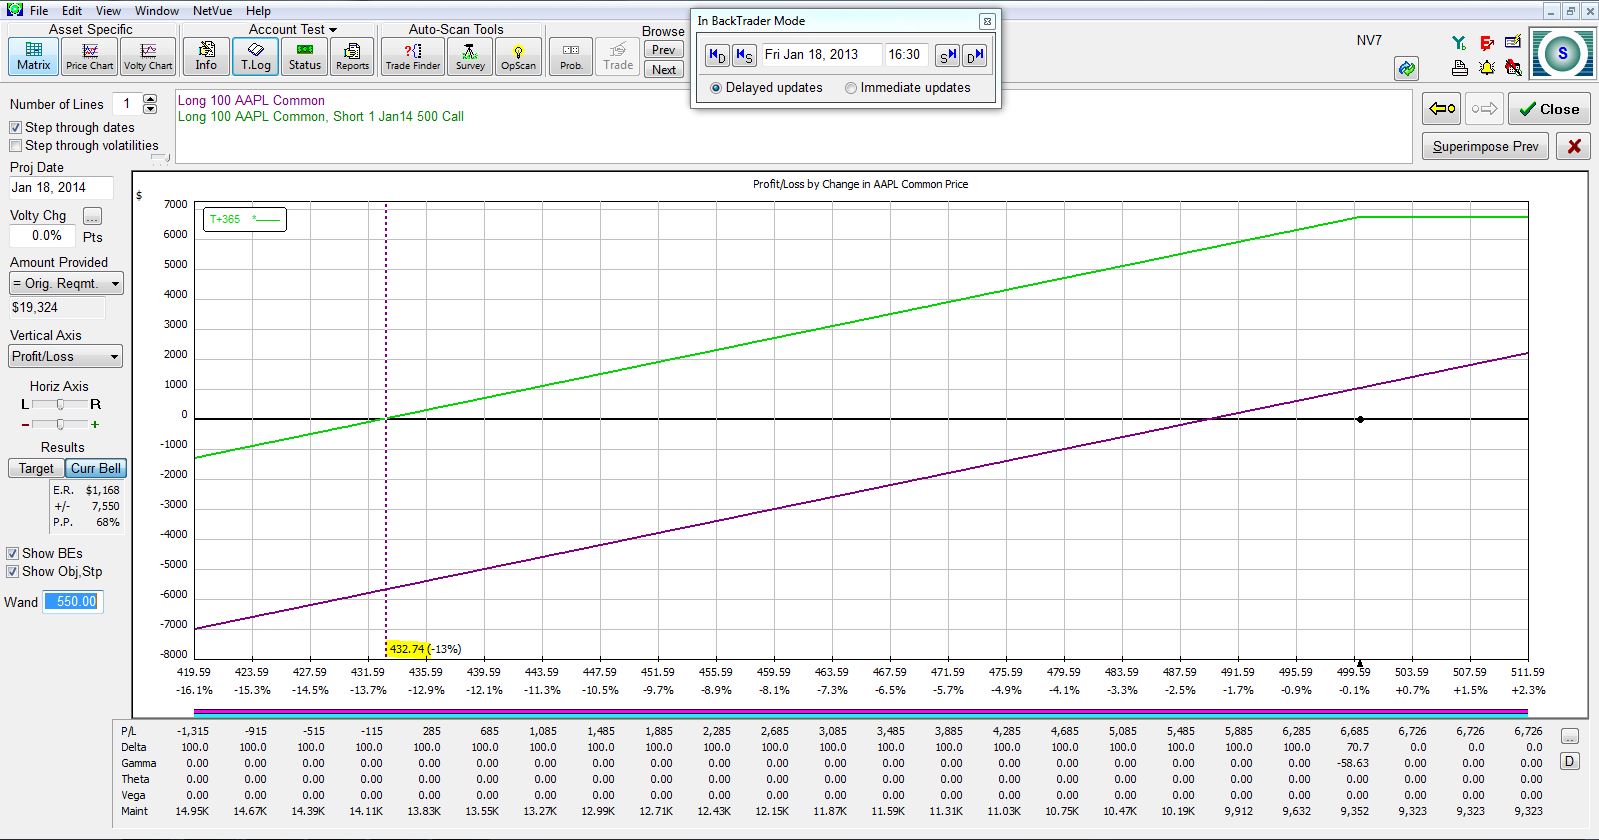
Viewed another way, for the CC (green line, below) to be at breakeven after one year, the stock would have to fall to 432.74, which is more than $55 lower than breakeven for the stock position (purple line, below) alone:
Either way you look at it, the stock is more risky than the CC.
Categories: Option Trading | Comments (6) | PermalinkCovered Calls and Cash Secured Puts (Part 2)
Posted by Mark on October 18, 2013 at 07:15 | Last modified: January 8, 2014 10:05A cash secured put (CSP) is a naked put (NP) covered by cash. If I sell the Nov 495 AAPL put, for example, then I would need $495/share * 100 shares = $49,500 in the account for a CSP.
While covered calls (CC) and NPs are synthetically equivalent, one apparent difference is that the CC is more expensive. In a margin account, a CC costs approximately 50% of the stock price whereas a NP costs approximately 20% of the stock price. I say this is an “apparent” difference because in the worst case scenario, the NP trade would require me to pay the strike price for a worthless stock. The total loss, then, would be the same loss incurred if the CC were traded: strike price minus the credit received for the option sale.
Practically speaking, only under exceptional circumstances would a NP [or CC] result in total loss. More commonly, the stock might lose value, which would force me to buy it (option assignment) for more than its current market price. That could result in substantial loss but at least I have shares that I can turn around and immediately sell. If I lose 10-20% of the stock’s purchase price or even 50% then that is still far less than total loss.
For this reason, some people suggest using NPs to establish “additional positions” in margin accounts. Assuming I have cash available to buy 100 shares, these gurus say it’s okay for me to sell 2-3 NPs because even this would only cost me 40-60% of the stock price. USE CAUTION, I say, because if the stock price falls sharply then you may be on the hook for more than you have. Your trading days could be over!
In a retirement account, all NPs require at least as much cash in the account to purchase the stock at the strike price. In other words, in a retirement account all NPs are CSPs.
Categories: Option Trading | Comments (0) | PermalinkCovered Calls and Cash Secured Puts (Part 1)
Posted by Mark on October 15, 2013 at 06:24 | Last modified: January 8, 2014 07:28In an effort to break my analysis paralysis and develop an additional stream of income, today I begin a blog series on covered calls (CC) and cash secured puts (CSP). I will begin today by defining the trades.
According to www.investopedia.com, a covered call is defined as:
> An options strategy whereby an investor holds a long position
> in an asset and writes (sells) call options on that same asset in
> an attempt to generate increased income from the asset.
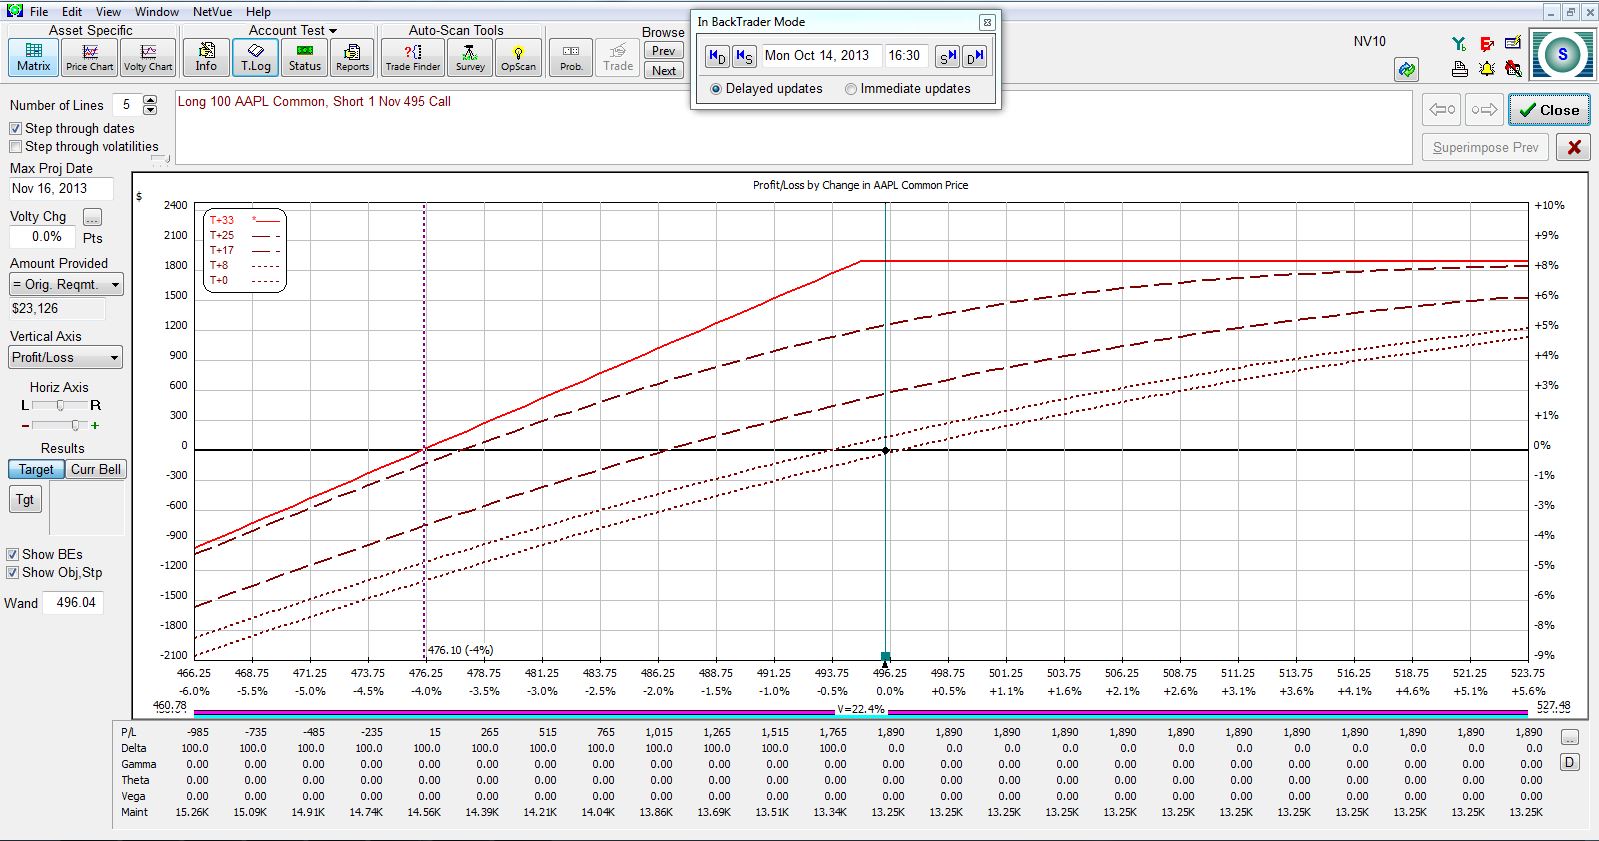
With Apple (AAPL) stock closing yesterday at 496.04, an example of this trade would be to purchase 100 shares of AAPL and sell a November (33 days to expiration) 495 put:
According to www.cboe.com:
> An investor who employs a cash-secured put writes a put contract,
> and at the same time deposits in his brokerage account the full
> cash amount for a possible purchase of underlying shares. The
> purpose of depositing this cash is to ensure that it’s available
> should the investor be assigned on the short put position and
> be obligated to purchase shares at the put’s strike price.
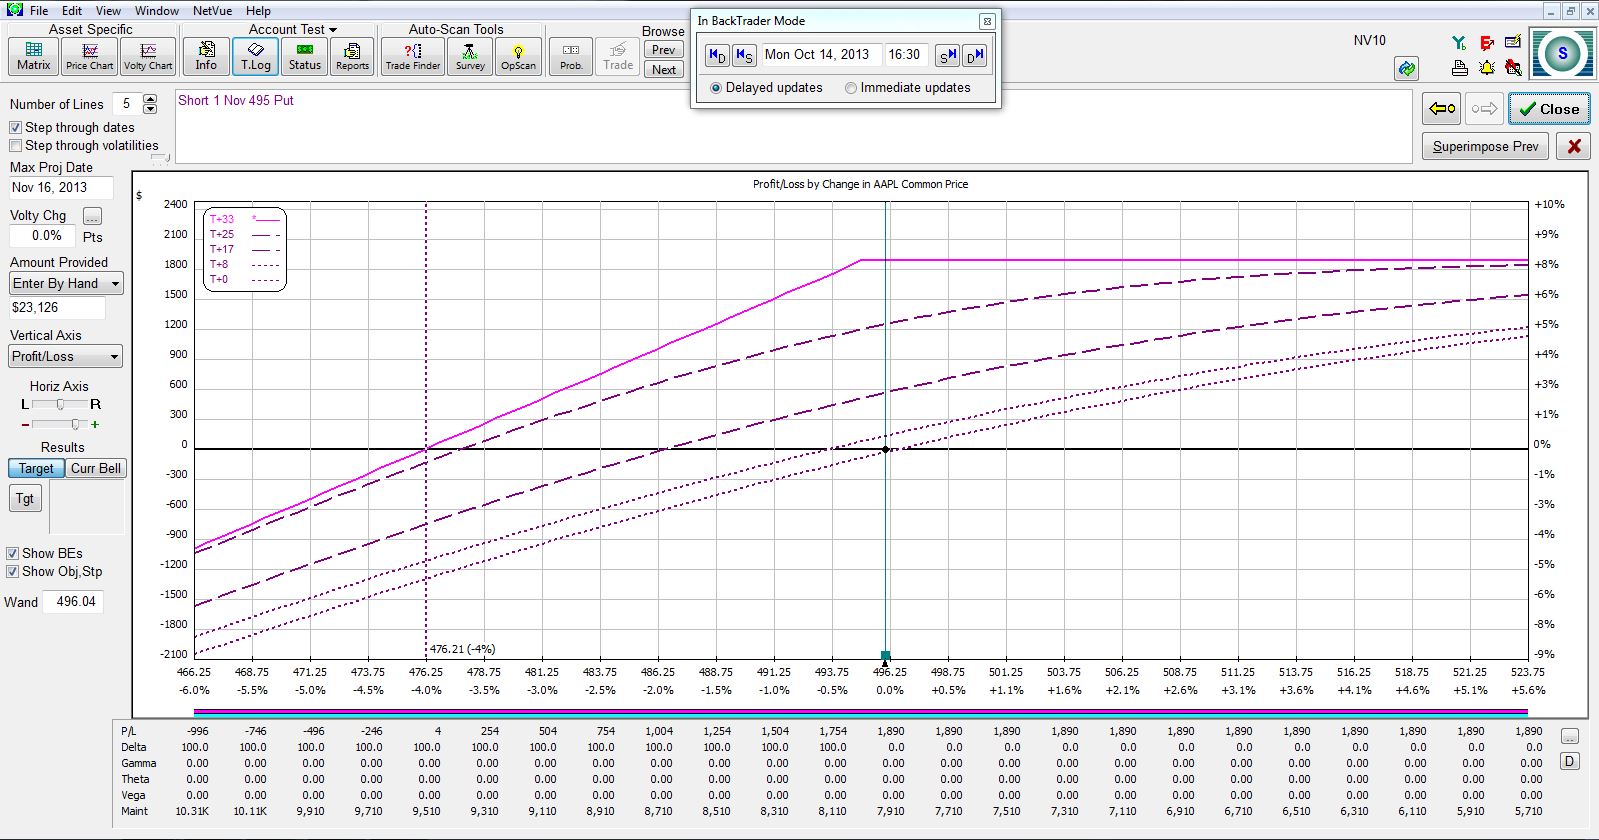
With Apple (AAPL) stock closing yesterday at 496.04, an example of this trade would be to sell one November (33) 495 put:
Notice that the two risk graphs are virtually identical. While the two may differ by a few bucks depending on the particular moment in time for the marketplace, if the same strike is selected to sell the call or put for the CC or CSP, respectively, then the trades are identical. These are known as synthetic positions.
While the trades are synthetically equivalent, the CC initially requires two brokerage commissions (buying stock and selling option) whereas the CSP initially requires one (selling option).
I will take a temporary detour with my next post and detail the “cash secured” nature of [naked] put selling.
Categories: Option Trading | Comments (3) | PermalinkRealistic Expectations (Part 4)
Posted by Mark on October 10, 2013 at 06:30 | Last modified: January 8, 2014 06:12Today I will conclude this blog series by talking about making a living through full-time trading.
I cannot accomplish this task by relying solely on trading income to cover monthly expenses. This is too much stress for anyone who is required to think clearly. Any trader will have periods of “feast” and of “famine.” If I require trading profits every month to pay the bills then at some point I am likely to fail. Treat trading as a business. Nobody starts a successful business without having savings to sustain them through the rough times until the business becomes profitable [again].
While I cannot rely on monthly income, I should aim to cover the expenses each and every month. I look to make $X per month. I don’t care what percent return that is or how it fares relative to the broad market. My goal is to avoid having to go back to work for someone else. If I cover my bills on a regular basis then I will be successful.
I would offer two footnotes to the above-stated points. First, while I do not care much about it, if my monthly requirements demand an unrealistic percent return then I need to be cognizant of that to lower risk of going bust. Second, for me a particular type of trading strategy is needed to trade for a living. Because the mortgage is due every month, my personality requires something that will make money most of the time. This means I need to place trades that give me a high probability of making my monthly requirement. More speculative trades tend to have a lower probability of profit, a higher reward-to-risk ratio, and are characteristic of less liquid markets. Speculative trades, as an experienced trader once described, can buy me “dinner and a movie” but are not something to trade with the goal of covering the mortgage. I need to understand the difference.
In summary, I need to implement critical thinking to help determine realistic expectations and then I need to develop a mind-set that keeps me focused on requisite monthly income generation rather than the commonly advertised percent return relative to a benchmark.
Prospective traders: you can do it!
Categories: Option Trading | Comments (0) | PermalinkRealistic Expectations (Part 3)
Posted by Mark on October 7, 2013 at 05:54 | Last modified: January 7, 2014 12:28As promised in my last post, today I will discuss some trading expectations that I do believe to be realistic.
I believe that profit potential is directly proportional to time frame. A trade that lasts minutes will make less than a trade that lasts days; both market movement and option decay occur in larger magnitude over a longer period of time. I believe position size should be smaller for less consistent trades and for trades with a smaller average-win-to-average-loss ratio. I believe shorter time frames are more inconsistent due to inherent volatility of the markets. Shorter time frames should therefore be traded in smaller size, which is also consistent with limited profit potential.
I believe the discussion of reasonable returns should end around 1% per month of my total net worth. At roughly 12% per year, this would knock the socks off historical stock market returns and make people like Warren Buffett or successful hedge fund managers very proud. I have seen many educational programs and newsletters that tout monthly returns of 5-10%. In my opinion, even claims as low as 2% per month should be closely scrutinized. Are losses taken into account? How long will it take to recover from a loss? If I leverage up with that strategy then will I lose everything after consecutive losses? If I limit position size to 1-2% of my total net worth then will I make enough money to offset the cost of the service?
I am a firm believer that chasing advertised returns can stifle my growth as a trader and/or may completely knock me out of the trading game sooner rather than later. Advertised returns are usually wildly exaggerated. I can use my critical thinking skills to figure out why on a case-by-case basis. The sooner I am able to discern reasonable expectations from misleading marketing, the sooner I will stop wasting time and money likely only to land me in the red.
Finally, I believe I can make a living trading. I’m not convinced that I can make millions of dollars doing this but I can pay the bills. The more money I wish to make as a percentage of my total net worth, the more likely I am to fail and suffer catastrophic loss.
I will conclude this blog series with my next post.
Categories: Option Trading | Comments (0) | PermalinkRealistic Expectations (Part 2)
Posted by Mark on October 4, 2013 at 06:42 | Last modified: January 3, 2014 09:05In an attempt to formulate a position on what I believe is reasonable to expect as a trader, I have begun by reviewing “trader wisdom” that was the focus of my last blog series.
Continuing on:
> It’s not that you can predict the future with it but you get comfortable with how [the market] reacts.
Yes, I can be comfortable on most days with how the market reacts: until a day rolls around when I am not. At some point the market will make a three, four, or greater standard-deviation move that can potentially knock my socks off. This is what I must prepare for each and every day even though I will only see it on rare occasion.
> I sit here in front of the screens all the time watching the 5-minute bars on all the futures and I’ve
> gotten very comfortable with my trades because I kinda know… I get decent entry points because I
> know how the market is moving around when I’m getting my trades on and I know when to just…
> hold off… doing my adjustment for 5, 10, or 15 minutes to see—you know, typically it’ll reverse here
> so I’ll wait and see and maybe get a better price.
This is too general to be meaningful. To me, the underlying tone suggests this happens regularly, which is not realistic. The subjective terms “comfortable,” “decent,” and “better” are all true if I am on a profitable streak and false if trading has hit the skids for my account.
> On this trade, I think it’s important to really understand how [the market] works so you can see
> the graph and see how these candles affect the trade.
This sounds good and I can see a large audience nodding heads but it becomes meaningless nonsense when I try to analyze it.
> You’ll see patterns among the stocks.”
I find it unrealistic to expect any patterns to be evident in live trading at the hard right edge of a price chart.
I’ll go more into realistic expectations in my next post.
Categories: Option Trading | Comments (1) | PermalinkRealistic Expectations (Part 1)
Posted by Mark on October 1, 2013 at 07:07 | Last modified: January 3, 2014 08:48What do I know? You must be the judge. I am now in my sixth year of trading for a living. Over that time, I am profitable net living expenses. In recent posts, I have dismissed much as the Holy Grail in sheep’s clothing and because of this, I feel it important to clarify my position on what I do believe is realistically possible to accomplish as a trader.
Let’s begin by reviewing the “trader’s wisdom” that was the subject of my last blog series:
> I think one of the most important things X teaches is trading the same market over and over and over again.
I do believe it is possible to trade one and only one market for a living.
> You get to the point where you don’t need any indicators.
I do believe I can trade for a living without indicators.
> You really understand how the market breathes.
I disagree. The time to be most cautious is when I think I understand how the market works because inevitably it will change direction and catch me with my pants down. If I ever start to believe this then I have become too arrogant.
> You get really comfortable [and really start to think] “okay, I know what I’m doing today.”
Do I know or was I just lucky? I’ll choose the latter and thank goodness each and every day that I’m still in the game.
I will finish the review in my next post.
Categories: Option Trading | Comments (2) | PermalinkSizing Risk (Part III)
Posted by Mark on May 2, 2012 at 23:34 | Last modified: October 1, 2012 05:52Sizing Risk is a common trading plan element that can pose a challenge to consistent profitability.
As discussed in Part I (http://www.optionfanatic.com/2012/04/26/sizing-risk-part-i/), these are scaling trading plans with a profit target of 15% and max loss of 20%. Suppose $10,000 is allocated per tranche for up to three tranches. The trade will then profit $1,500, $3,000, or $4,500–fifteen percent–depending on how many tranches are placed. When the trade loses, it will usually be after completely scaling in: 20% of $30,000 is $6,000 lost.
This monthly trade will therefore have to profit at least 75% of the time to be profitable. If the trade wins eight months out of 12 and averages two tranches for each winning month then in one year it will make 8 months * $3,000/month = $24,000 and lose 4 months * $6,000/month = $24,000. If the trade only wins seven months and loses five months then the annual return will be -30%. Should it have a tough year and lose exactly as often as it wins, the annual return will be -60%, which is nothing less than a good recipe for grounding an account into hamburger meat.
As discussed in my posts on the naked put selling strategy (http://www.optionfanatic.com/2012/03/25/the-naked-put-part-iii/), a common worry amongst traders is to have one catastrophic loss that wipes out many profitable months. Sizing Risk teaches us that making too little in the winning months can be just as harmful to overall returns as catastrophic losses but is much more frequently overlooked.
Tags: income trading | Categories: Money Management, Option Trading | Comments (0) | PermalinkSizing Risk (Part II)
Posted by Mark on April 30, 2012 at 13:31 | Last modified: April 30, 2012 15:02In Part I on Sizing Risk (http://www.optionfanatic.com/2012/04/26/sizing-risk-part-i/), I described a scaling strategy that aims for a 15% profit target and 20% max loss. Because allocated capital may remain on the sidelines, the strategy actually aims for a 10% average profit target with 20% max loss. This lowered profit target raises a challenge to profit factor because it loses even more in bad months than it profits in good months.
If the trade reaches 15% profit on 33% or 67% of allocated capital then why not hold the trade until it reaches 45% or 22.5% profit respectively, which would be the same net profit as 15% on 100% of allocated capital?
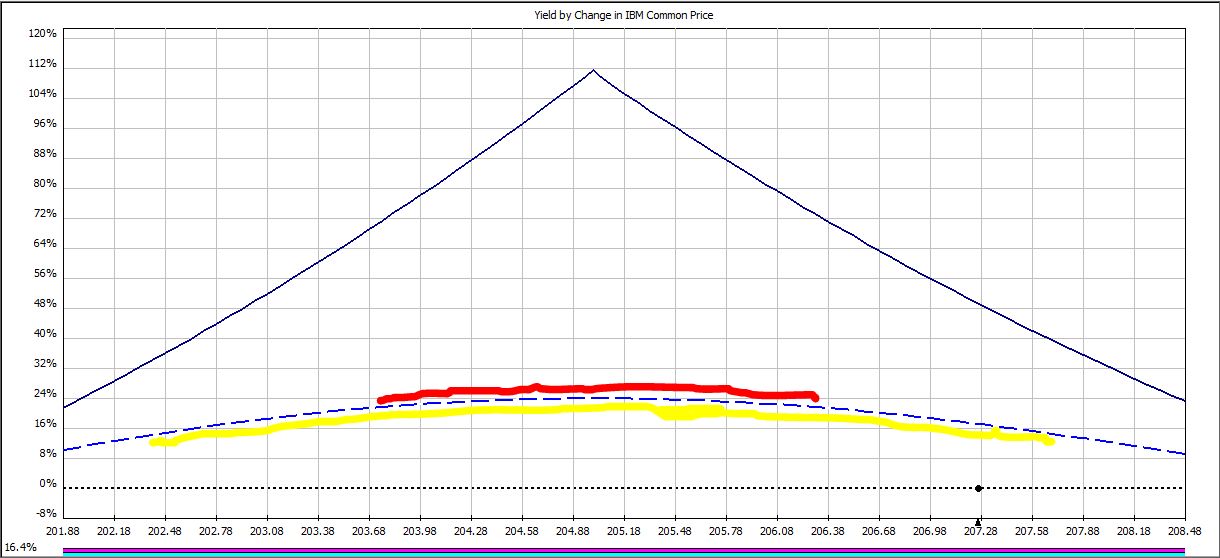
On certain days, a profit target may be hit when IBM trades within a price range. For example, to hit the 22.5% profit target on trade day 12:
IBM must trade within a range only 22% as wide (red line) as it must trade to hit the 15% profit target (yellow line).
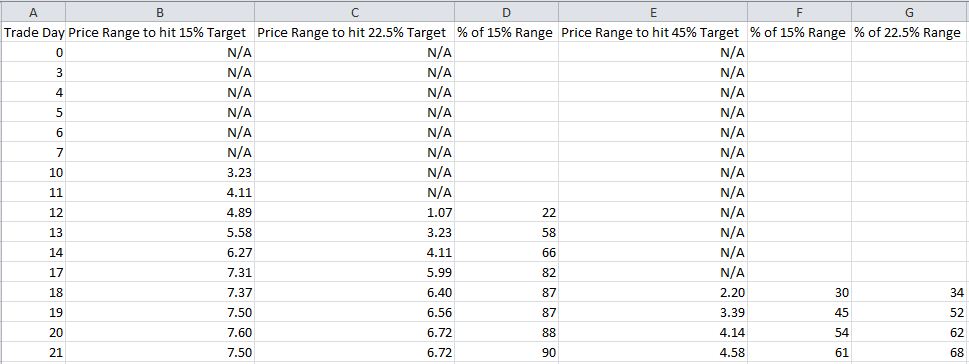
In the table below, Columns B, C, and E describe the range of price ($) in which IBM must trade to hit the three profit targets:
Out of 16 total, the 15%, 22.5%, and 45% profit targets may only be hit on 10, 8, and 4 trading days, respectively. As profit target increases, fewer days are available to hit the target.
Next, study Columns D, F, and G, which compare the magnitude of price ranges over which profit targets will be hit. I made a Day 12 comparison with the red and yellow lines, above. Columns F and G indicate that on two out of the four days when the 45% profit target may possibly be hit (Days 18 and 19), the price range is 52% as wide or less than that required to hit the lower profit targets.
Not only do higher profit targets allow for fewer days when price targets may be hit, they also mean for a lower chance of hitting targets on those days.
My last post on negative gamma risk (http://www.optionfanatic.com/2012/04/27/undressing-negative-gamma-risk/) explains this. As option expiration approaches, routine changes in stock price can cost us more and more money–potentially even turning a nicely profitable trade into a loser at the last moment.
This is the argument against holding a modestly profitable trade longer in an attempt to hit the higher profit targets.
Tags: income trading | Categories: Money Management, Option Trading | Comments (0) | PermalinkUndressing Negative Gamma Risk
Posted by Mark on April 27, 2012 at 13:42 | Last modified: April 27, 2012 13:46It’s rumored that fear and greed are the two emotions that drive markets. As an options trader I would argue that psychic pain, otherwise known as negative gamma risk, should be listed as the third.
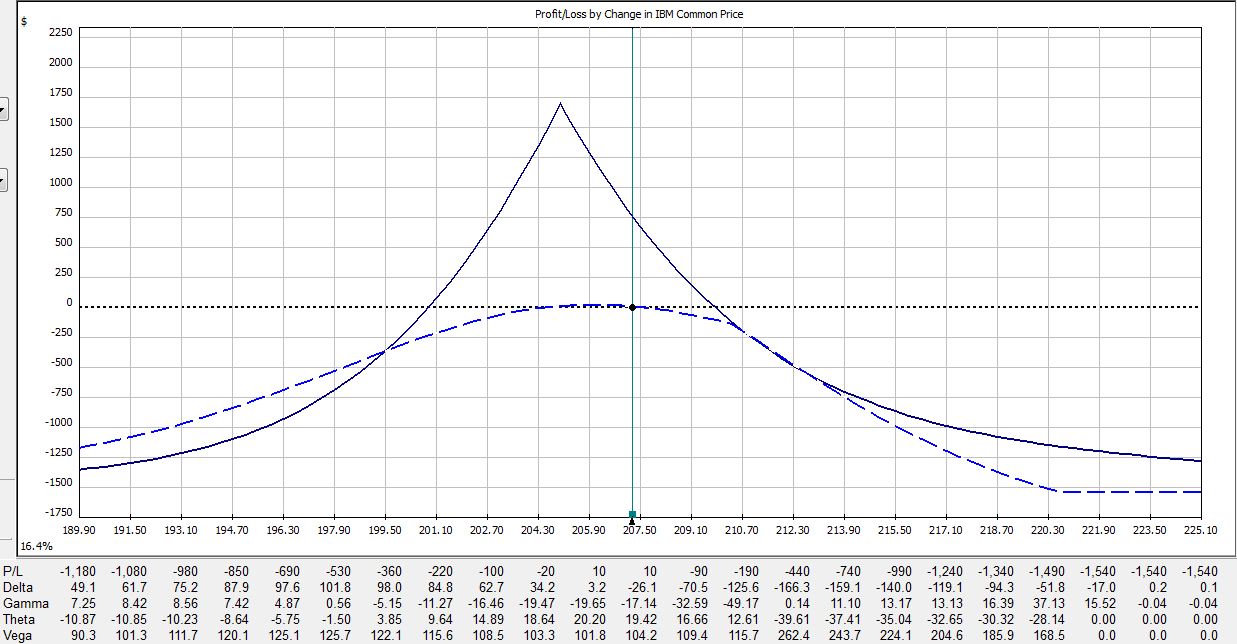
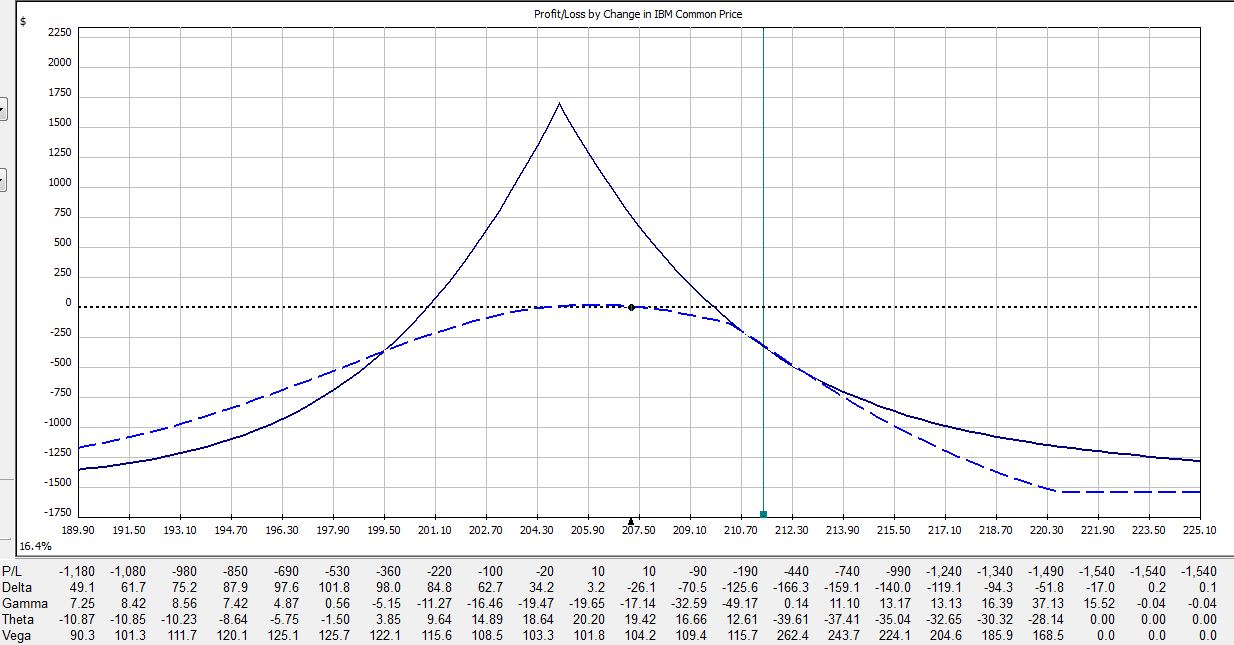
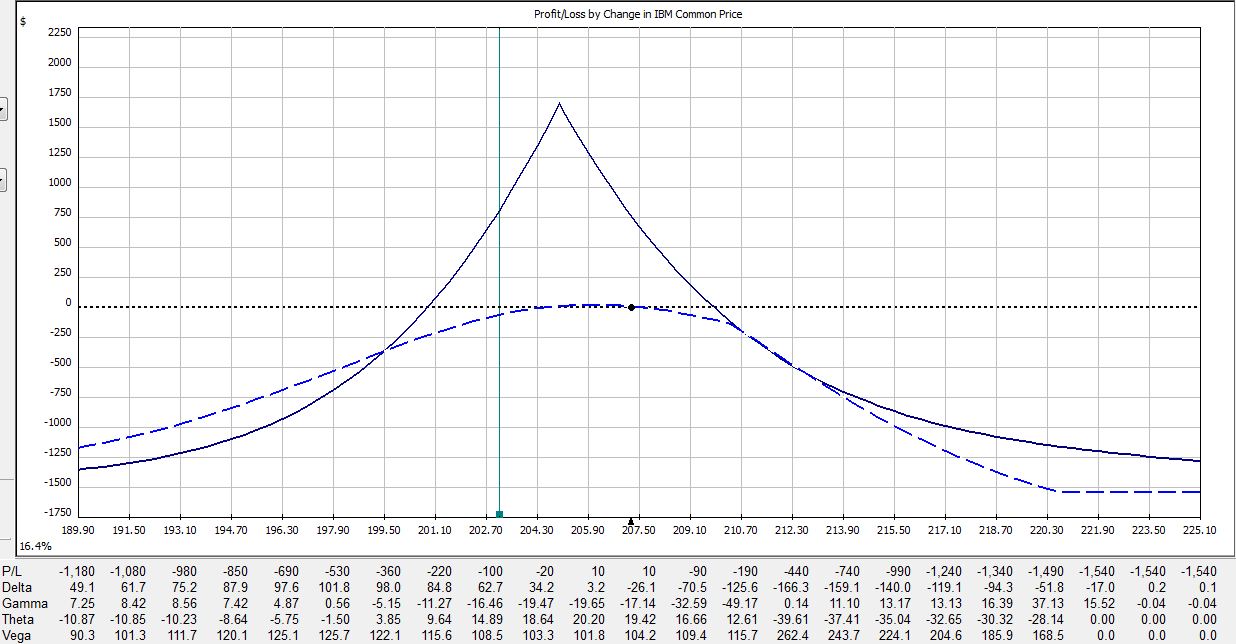
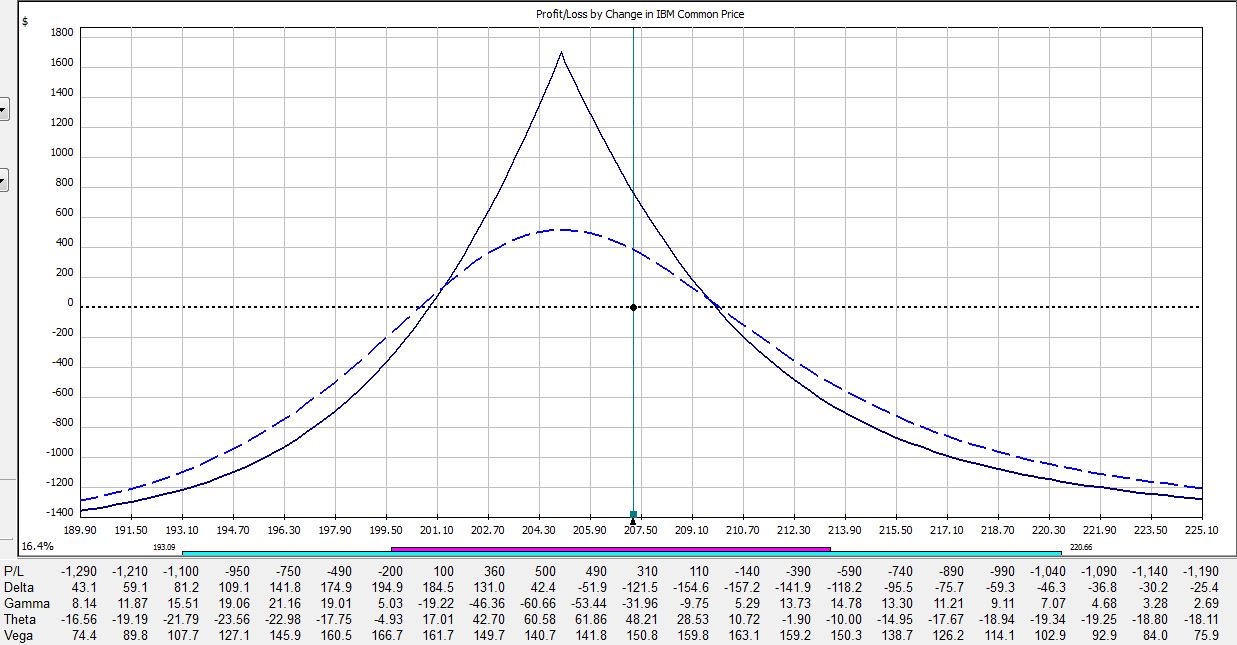
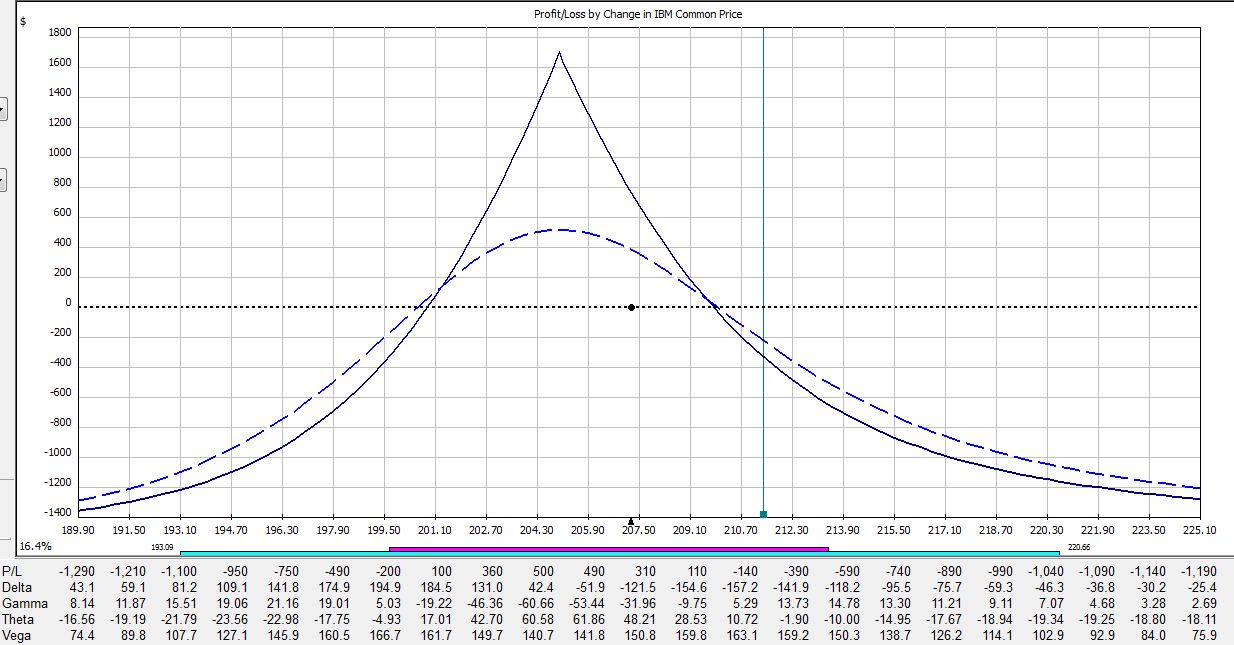
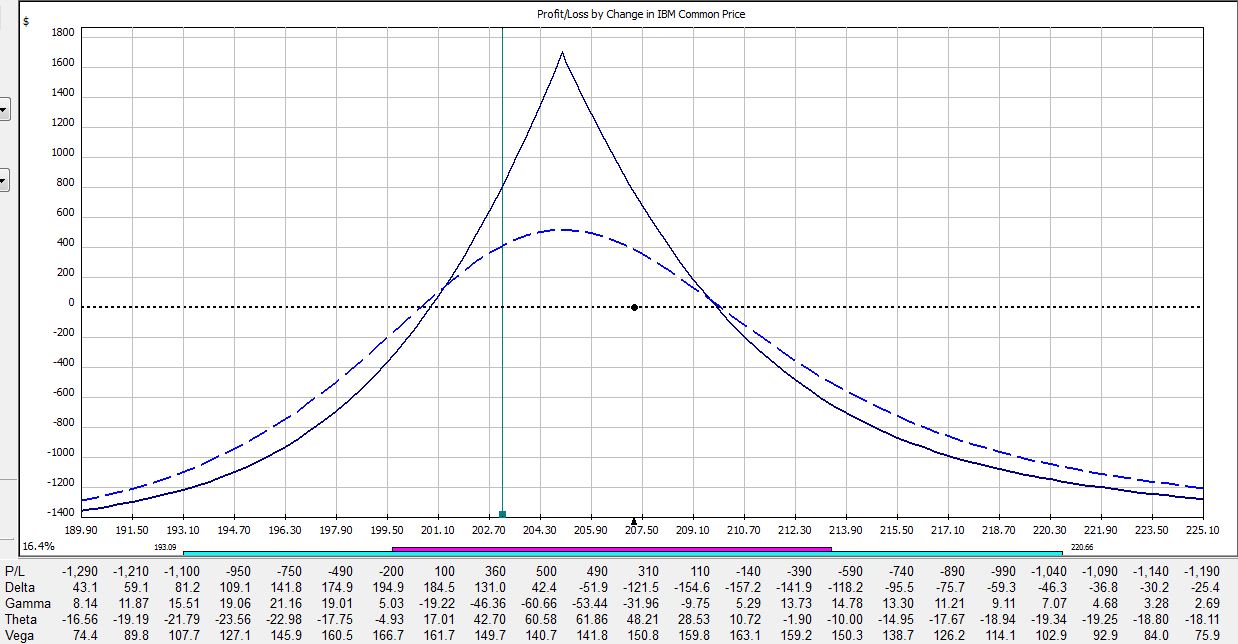
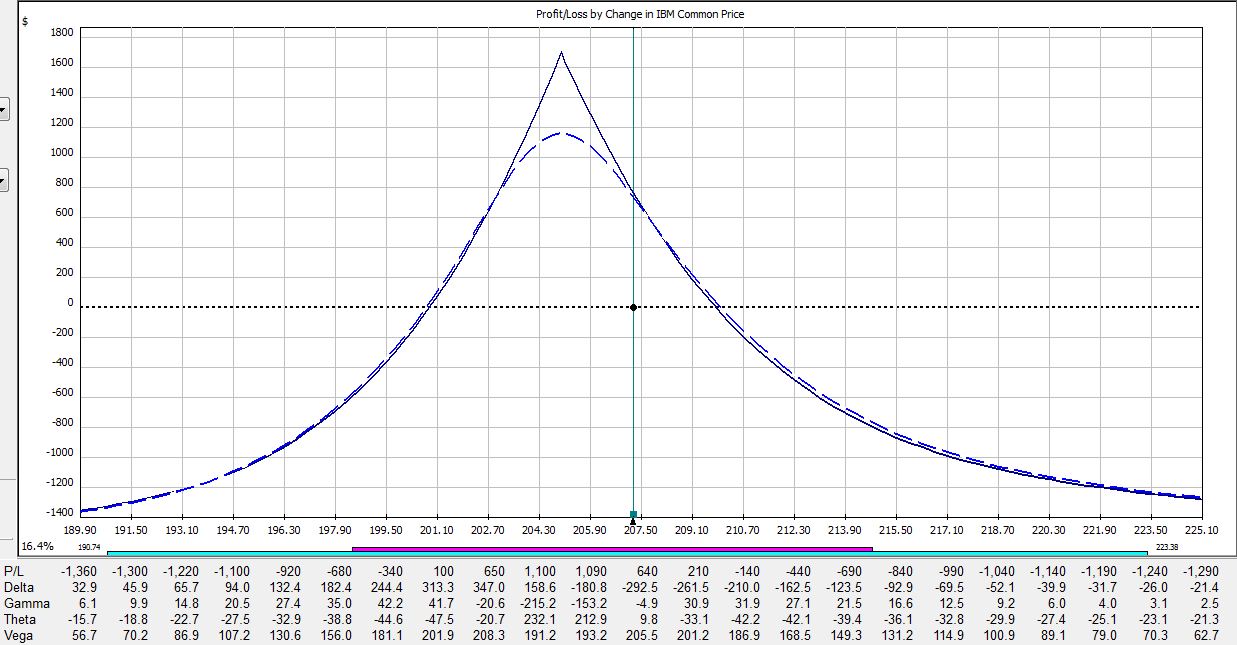
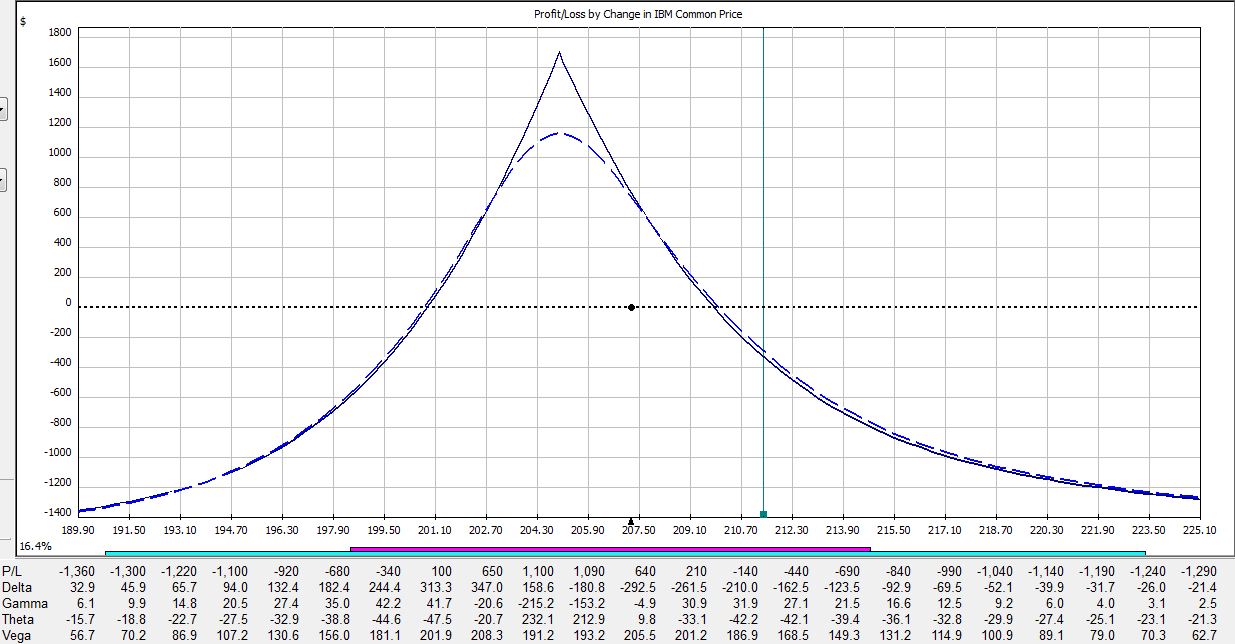
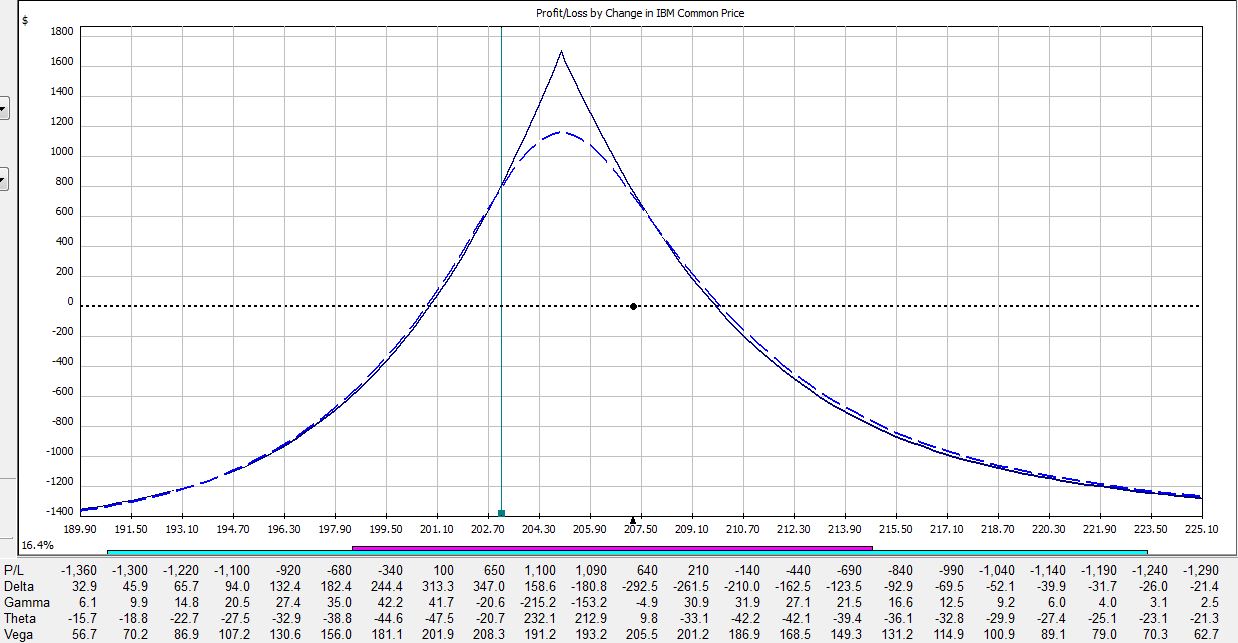
All pictures are risk graphs of a May/Jun 205 IBM call calendar trade (10 contracts) placed today (4/27/12), which is 22 days to May expiration. The P/L is the intersection of the green, vertical line and the blue dotted line.
At trade inception, we have this:
If IBM were to move up 2% today then the trade would be down $309:
If IBM were to move down 2% today then the trade would be down $50:
If IBM were to remain unchanged then in 15 days the trade would be up $353:
If IBM were to move up 2% then in 15 days the trade would be down $225:
If IBM were to move down 2% then in 15 days the trade would be up $400:
If IBM were to remain unchanged then in 21 days on the Friday before option expiration, the trade would be up $720:
If IBM were to move up 2% then in 21 days the trade would be down $275:
If IBM were to move down 2% then in 21 days the trade would be up $790:
Here is a summary of these changes in percentage return on investment:
The table says at trade inception, a 2% move in the stock could result in a 20% loss. In just over two weeks, that 2% move in the stock could result in a 38% loss. On the day before option expiration, that 2% move in the stock could result in a 65% loss!
Psychic pain is seeing routine moves in the underlying suddenly have huge effects on the P/L. At some point, many traders would opt to close the trade so as not to worry about this negative gamma risk. Negative gamma risk can keep you up at night.
Graphically, gamma represents how tightly curved the P/L curve is. As option expiration approaches, gamma becomes huge. While many option trades are capable of “home run” sized returns, it’s truly a shot in the dark because normal moves in the underlying may cost you huge chunks of profit.
Tags: trader education | Categories: Option Trading, Uncategorized | Comments (1) | Permalink