Covered Calls and Cash Secured Puts (Part 20)
Posted by Mark on January 2, 2014 at 07:18 | Last modified: January 24, 2014 09:17In the last post of this blog series, I illustrated the adjustment technique of rolling out as a way to continue a CC/CSP trade. Rolling out may also be used to delay assignment or avoid assignment altogether.
The Part 19 example showed how rolling out may be used to continue a successful CC/CSP trade in a sideways market.
Rolling out may also be used if the market trades lower, thereby putting the CSP ITM. Recall that a short option is at risk for assignment when time value approaches zero. This typically occurs near expiration or when the option goes deep ITM. Rolling out refreshes the trade by closing an option with little time value remaining and opening one with more time value (read: profit potential!) remaining. The trade profits through time decay provided that intrinsic value decreases or remains constant.
Rolling out provides more time for the position to work in my favor. An ITM CSP approaching expiration becomes a longer-dated ITM CSP after rolling out. The position continues to be ITM and this often makes traders uncomfortable. I now have more time for the market to reverse and turn higher, though. If the stock price has rallied above the short strike at the new expiration date then the CSP will expire worthless and I will realize total profit without ever being assigned.
If I don’t want to roll out when my CSP goes ITM then I can take assignment. This is not a bad outcome because by definition, I have cash available in my account to purchase the stock. I can then continue the trade by selling a CC against it. Since this is a synthetically-equivalent trade to the CSP, the choice is yours.
One reason to prefer the CC over CSP might be dividends. I will address this point in a later post.
Categories: Option Trading | Comments (0) | PermalinkCovered Calls and Cash Secured Puts (Part 19)
Posted by Mark on December 27, 2013 at 06:36 | Last modified: January 24, 2014 07:38Having talked about exercise and assignment, today I will discuss a trade management strategy for use in sideways/down markets called “rolling out.”
Rolling out is a common approach to adjusting an option position. When I roll, I buy to close a short option and sell to open an option at a later expiration date. I am thereby rolling the expiration farther out in time.
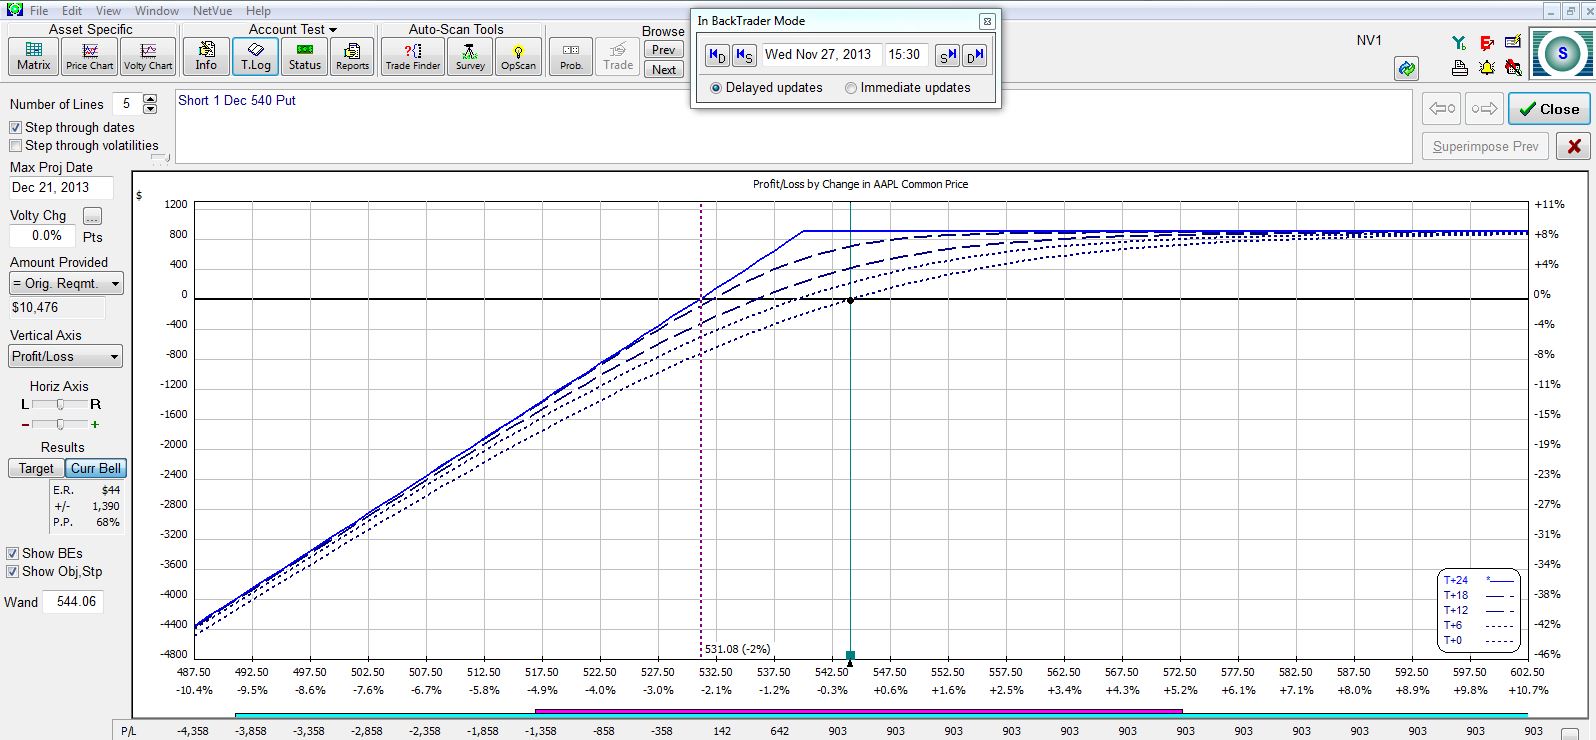
For an example, let’s go back to November 29, 2013, with AAPL trading at 556.08. Suppose I initiate a Dec(22) 540 CSP:
The legend in the bottom right identifies the different curves over time. At the bottom, I can see how the position gains (loses) money today (T+0) as AAPL stock moves up (down). The top, solid curve is the expiration line that shows PnL of the position at option expiration, 24 days into the future (T+24).
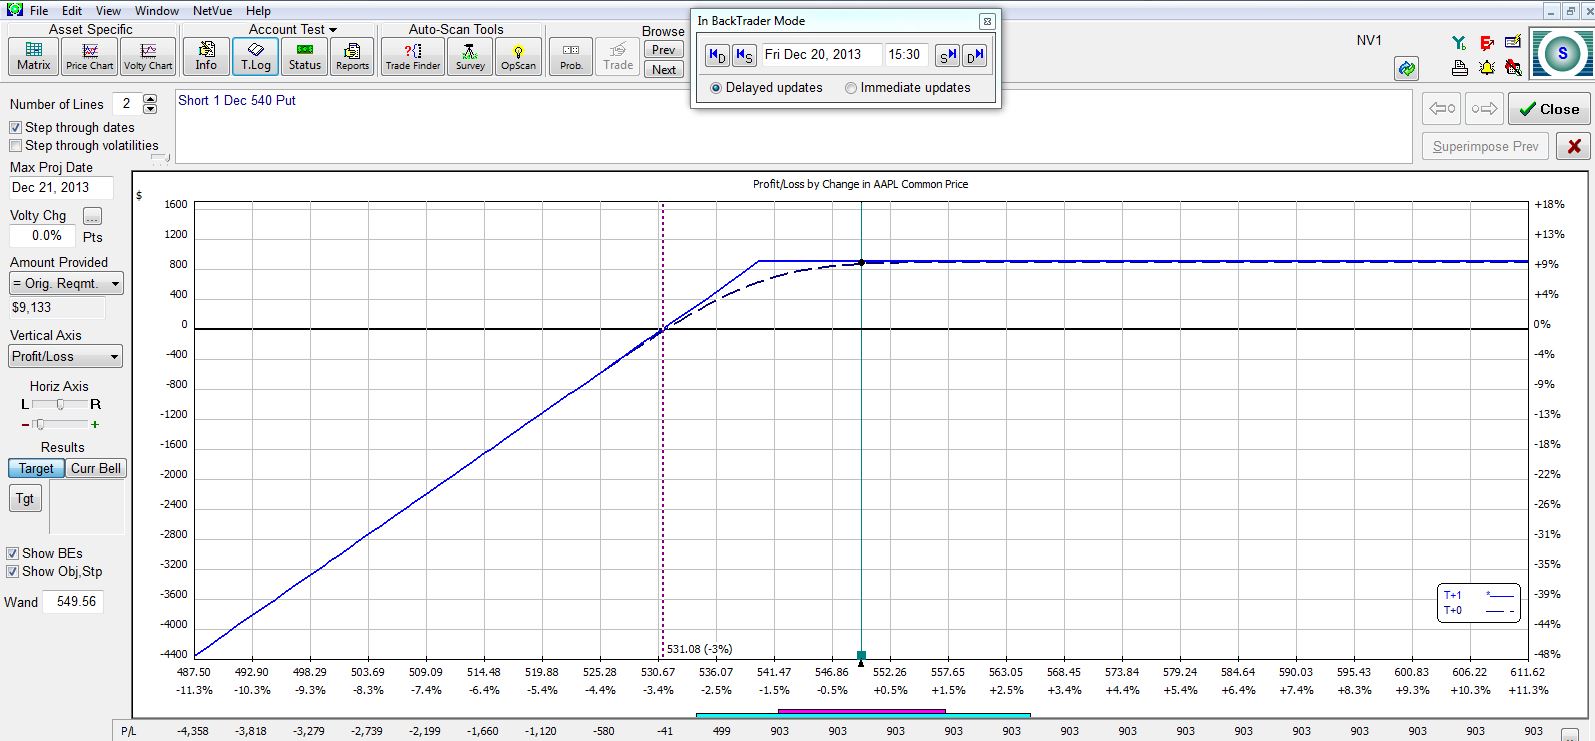
Let’s fast forward to the last trading day before expiration. AAPL is now trading at 549.56, which is down just over 1% from where I initiated the trade. Trading has been roughly sideways and the position has made $891:
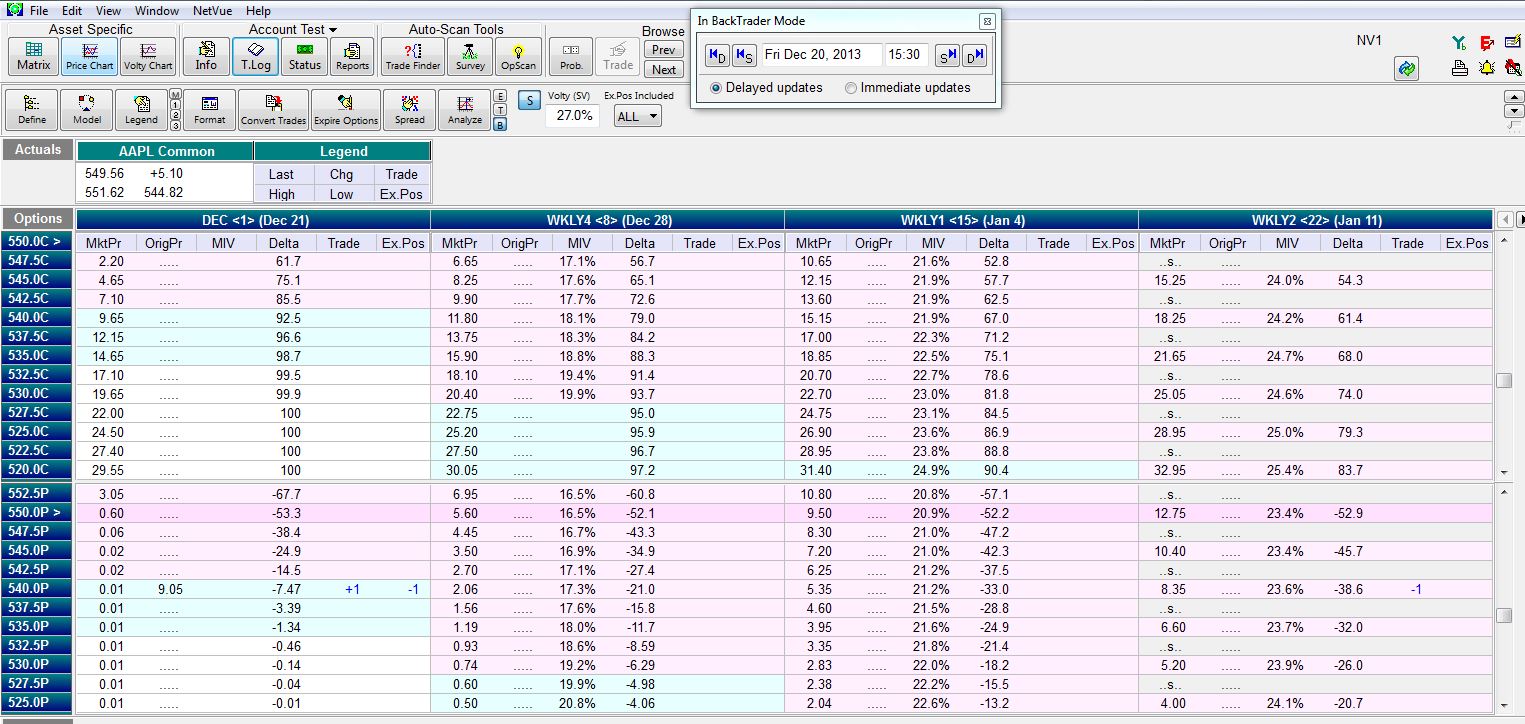
The CSP is about to expire worthless, which will enable me to keep the $903 I originally sold it for. If I wish to continue the trade then I can roll out the CSP:
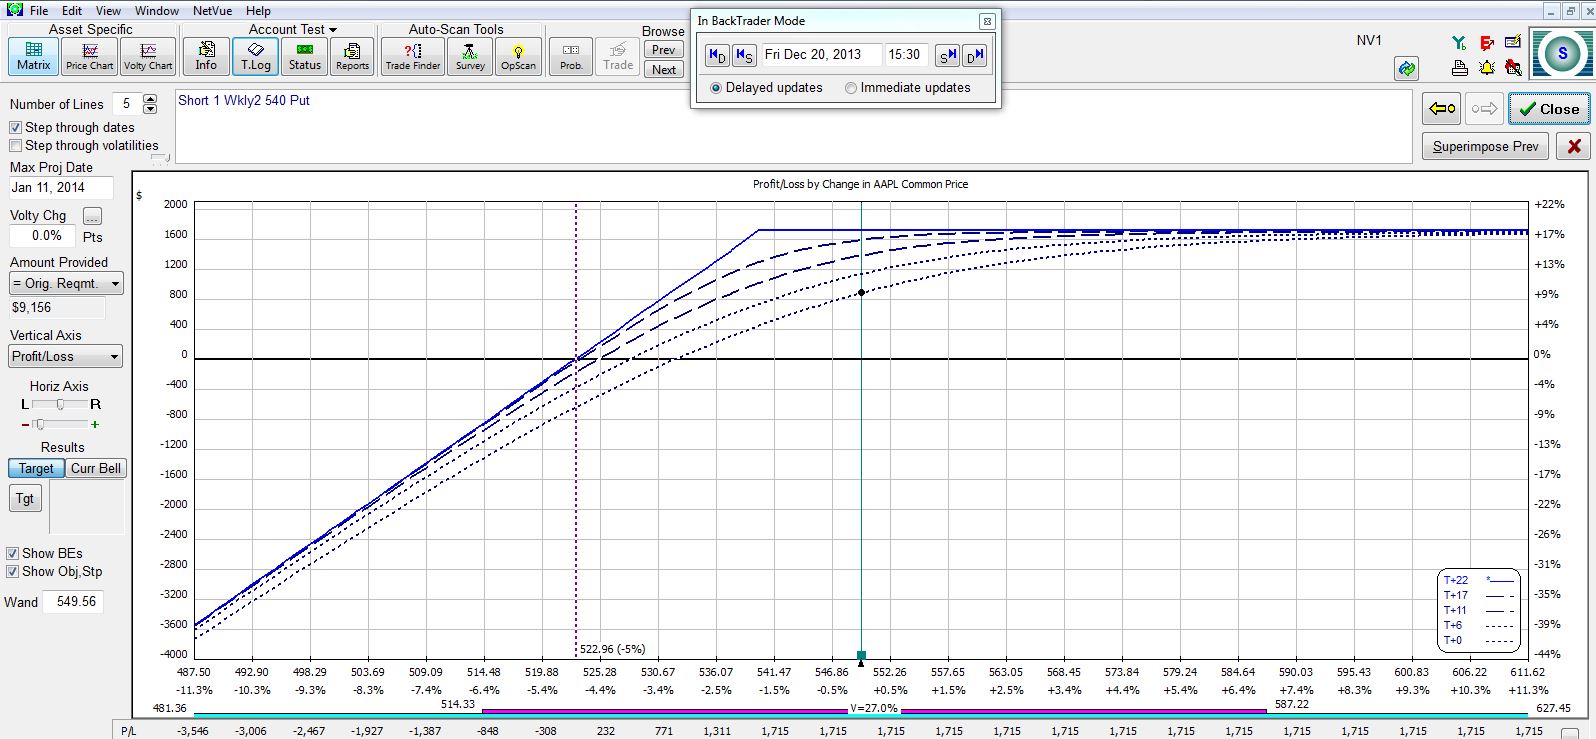
In the “Trade” column, you can see I am buying to close the existing short put (+1) and selling to open a new put (-1) at the same strike price three weeks later. The new risk graph is shown below:
If the stock continues to trade sideways or move higher then this position will make an additional $824 for a total potential profit of $1,715. The price chart shows where the stock needs to trade for the position to make or lose money:
While this roll is an adjustment, I could easily just let the trade expire and begin a new CSP trade at the same strike and later expiration date. The difference is mostly semantic.
I will talk more about rolling out in my next post.
Categories: Option Trading | Comments (2) | PermalinkCovered Calls and Cash Secured Puts (Part 18)
Posted by Mark on December 23, 2013 at 06:31 | Last modified: January 24, 2014 08:50I left off discussion with what might be assigned sooner: CCs or CSPs? Today I want to give two further considerations.
A short put is likely to be exercised sooner than a short call in order to maximize collection of interest payments.
However, neither short puts nor short calls are likely to be assigned when they have time value remaining. Option premium is composed of intrinsic value [how far in-the-money (ITM)] and extrinsic (time) value. Option exercise involves surrender of all remaining time value.
Consider call (put) owners who want to buy (sell) the stock. If the option still has time value then the fiscally responsible choice would be to sell the call (put) thereby recovering the time value and then to buy (sell) stock on the open market as a separate trade. This costs two commissions but at many brokerages, the charge for exercise/assignment is comparable to that of the stock and option trade combined.
Options are more at risk of being assigned as expiration approaches or as they go deep ITM because these are the cases when time value dwindles.
One potential exception that applies to calls only is when a stock goes ex-dividend. On this date, owners of the stock are entitled to a dividend payment, which generally occurs soon after. Even though I generally prefer to delay payments, as a call owner who wants the stock I might be willing to buy [stock] sooner if it means collection of the dividend.
More specifically, a short call is at risk of early assignment typically the day before the ex-dividend date when the dividend payout exceeds the time value remaining in the option.
One piece of good news for a CC trader upon assignment is the flip side of what I said above about option exercise: instant gain of all remaining time value without having to wait until expiration.
In my next post I will resume discussion of CC/CSP trade management.
Categories: Option Trading | Comments (1) | PermalinkCovered Calls and Cash Secured Puts (Part 17)
Posted by Mark on December 20, 2013 at 07:09 | Last modified: January 23, 2014 09:40In my last post, I talked about ways to manage CC/CSP winners when the market moves up. Today I want to discuss some details about exercise and assignment, which may occur if the stock moves down.
I should never place a CSP trade if I do not feel okay about owning the stock. In selling a put, after all, I am legally accepting the obligation to buy stock at the strike price anytime before option expiration.
Q: who would I be purchasing the stock from?
A: put owners, who have purchased the right to sell stock at the strike price on or before option expiration.
Put owners may exercise their right to sell stock while put sellers have an obligation to buy stock if assigned. When a put owner exercises, the put seller gets assigned. This is the lingo.
Q: why might assignment of a short [cash-secured] put be more likely to occur before assignment of a short [covered] call?
A: this is a loaded question.
If the stock moves lower then short [cash-secured] put assignment will likely occur whereas the [covered] short call will likely expire worthless. If the stock moves higher then the [cash-secured] short put will likely expire worthless whereas [covered] short call assignment will likely occur.
This detail aside, short puts are likely to be assigned sooner than short calls in stocks that pay no dividend. The higher the interest rate, the truer this becomes. When put owners exercise their right to sell stock, they will be raising cash. When call owners exercise their right to buy stock, they will be losing cash. People like to maximize the collection of interest, which means raising cash sooner and losing cash later.
Stocks that pay dividends are a separate case that I will discuss in my next post.
Categories: Option Trading | Comments (1) | PermalinkCovered Calls and Cash Secured Puts (Part 16)
Posted by Mark on December 17, 2013 at 03:04 | Last modified: January 22, 2014 03:50As you can read about here and here, I have recently been writing about tradeoffs to consider before placing a CC/CSP trade. Today I will begin to discuss management of winning trades.
As mentioned here, the CC/CSP trade is bullish and one possibility of how to manage a winner is to do absolutely nothing. In the case of a CC, the short call gets assigned and my stock gets sold. I will likely have to pay an exercise/assignment fee that should be factored into the plan before trade inception. In the case of a CSP, the short put will expire worthless and I will be “back to cash” with whatever margin requirement was originally committed to establish the position.
If I want to actively manage winners then I could opt to close the trade early. Revisiting a risk graph from a few posts ago:
If AAPL jumps to $600/share today, then notice how the lower dotted line (T+0 curve) has climbed nearly to the solid, expiration curve. In one day, the trade has made $319 out of a possible $366. Is it worthwhile for me to hold the position another 15 days to make the remaining $47?
In tabular form, the decision looks like this:
I believe this makes a strong case for closing the trade early. If I could do this on a regular basis and make 141%/year on every trade then I’d be a very successful trader.
In addition to boosting returns, another reason to close winning trades early is to protect both profits and mental stability. If I were up 87% of my potential profit after a few days and the market reversed to land me with a loss after 16 days then I would be angry, depressed, downtrodden, etc. Is it really worth losing everything (and possibly more) to make the final 13% on the trade? I used to think so until it happened a few times. I have since changed my tune.
Next time I will begin discussion on what to do when the market goes against me.
Categories: Option Trading | Comments (1) | PermalinkCovered Calls and Cash Secured Puts (Part 15)
Posted by Mark on December 12, 2013 at 01:39 | Last modified: January 22, 2014 02:27In a recent post, I discussed moneyness as a variable to CC/CSP trading that must be considered with regard to tradeoffs. Another such variable is time to expiration of the short option.
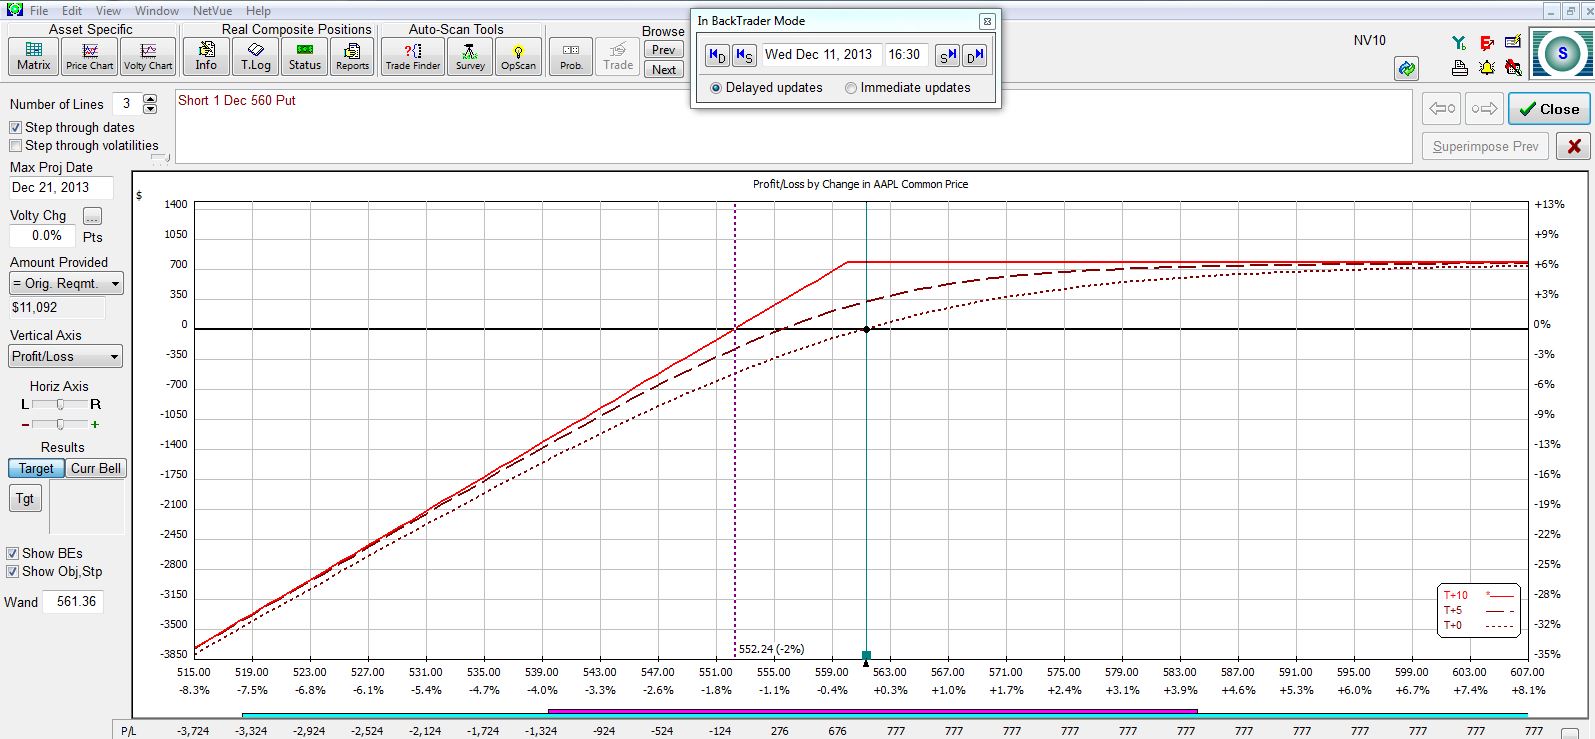
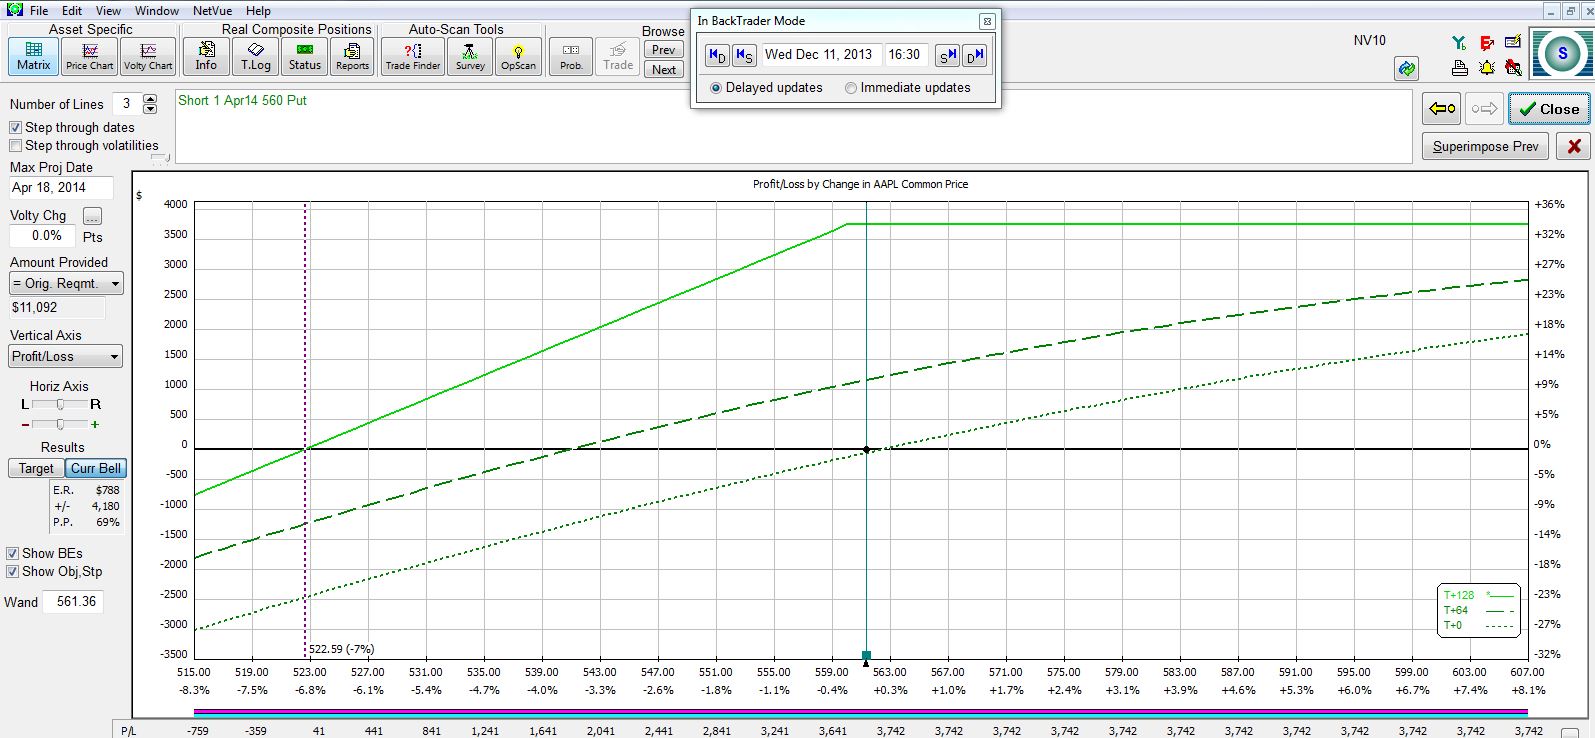
Days to expiration (DTE) of the short option is the number of days between now and option expiration. Consider AAPL stock, which closed yesterday at $561.36. If I wanted to trade a CSP at the $560 strike then I might sell one with 10 DTE:
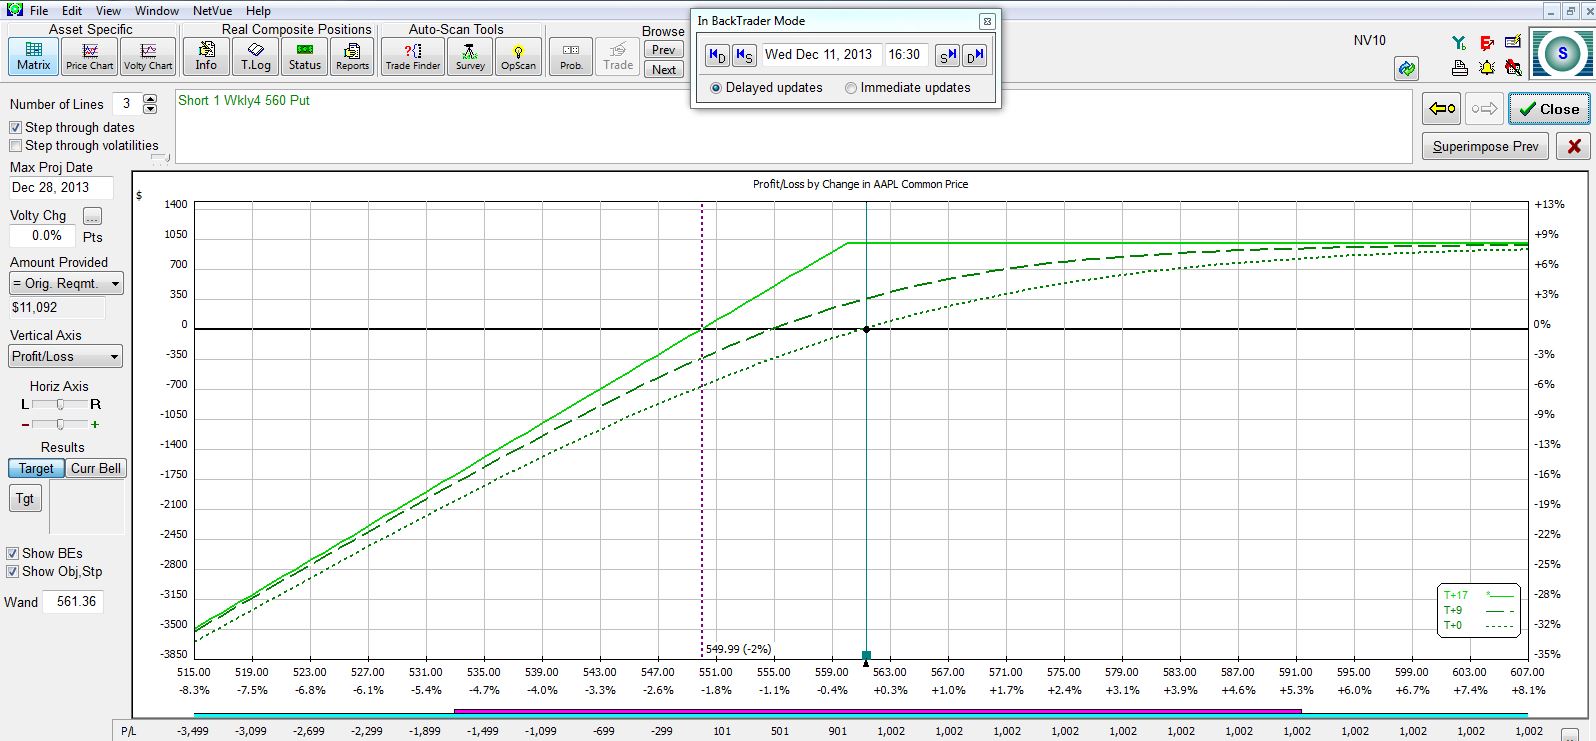
I might go out to the next weekly option with 17 DTE:
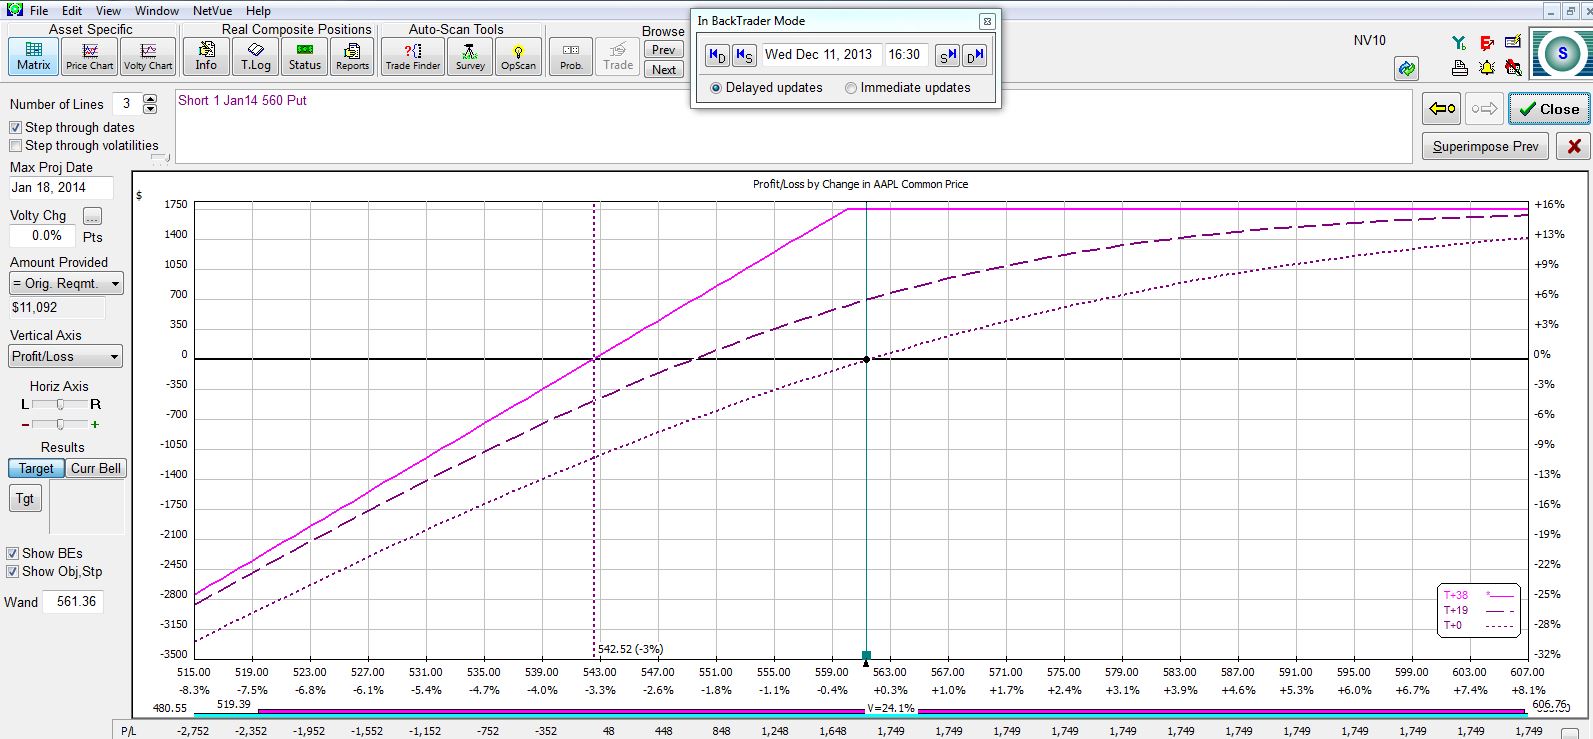
The January monthly CSP at 38 DTE looks like this:
The March monthly CSP at 128 DTE looks like this:
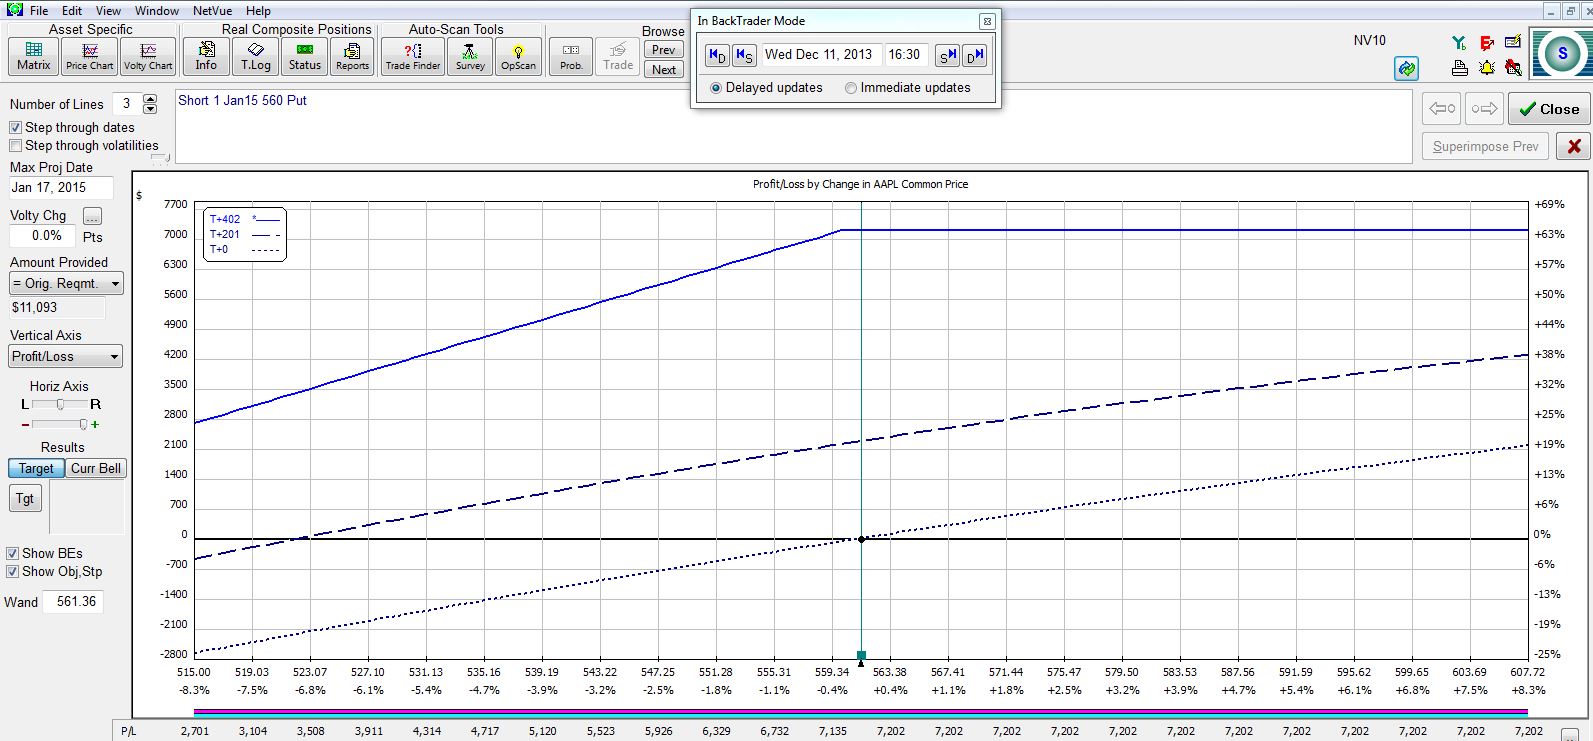
The January 2014 LEAPS at 402 DTE looks like this:
The following table summarizes the five potential trades:
Once again, I have tradeoffs to consider! The longer to expiration I sell, the greater my potential profit, the lower my breakeven, and the lower my annualized return. If I am extremely bullish on the stock then I might look to sell the shortest dated option and repeat the process every week or two to get the greatest annualized return and the least downside protection. If I think a market correction is around the corner then I might look to sell an option farther out in time to give me more downside protection in exchange for a lower annualized return.
As was the case with moneyness, no right answer exists. My personality or the overall allocation of my portfolio (e.g. diversification over time) might demand one over another.
I will continue with more discussion of the CC/CSP trade in my next post.
Categories: Option Trading | Comments (0) | PermalinkCovered Calls and Cash Secured Puts (Part 14)
Posted by Mark on December 9, 2013 at 05:22 | Last modified: January 21, 2014 12:09In my last post, I discussed differences in moneyness with regard to the short option. I also introduced the concept of “downside protection.”
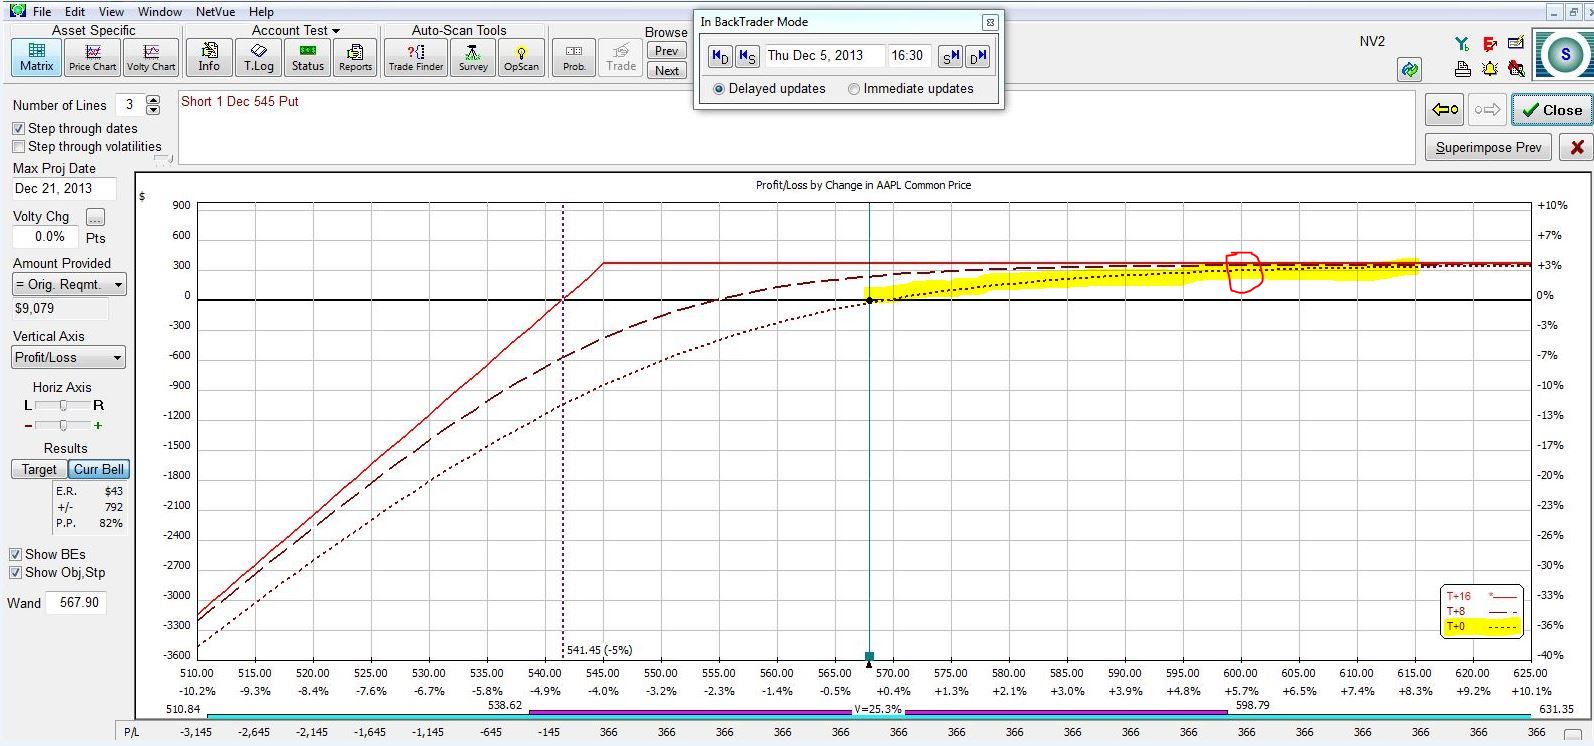
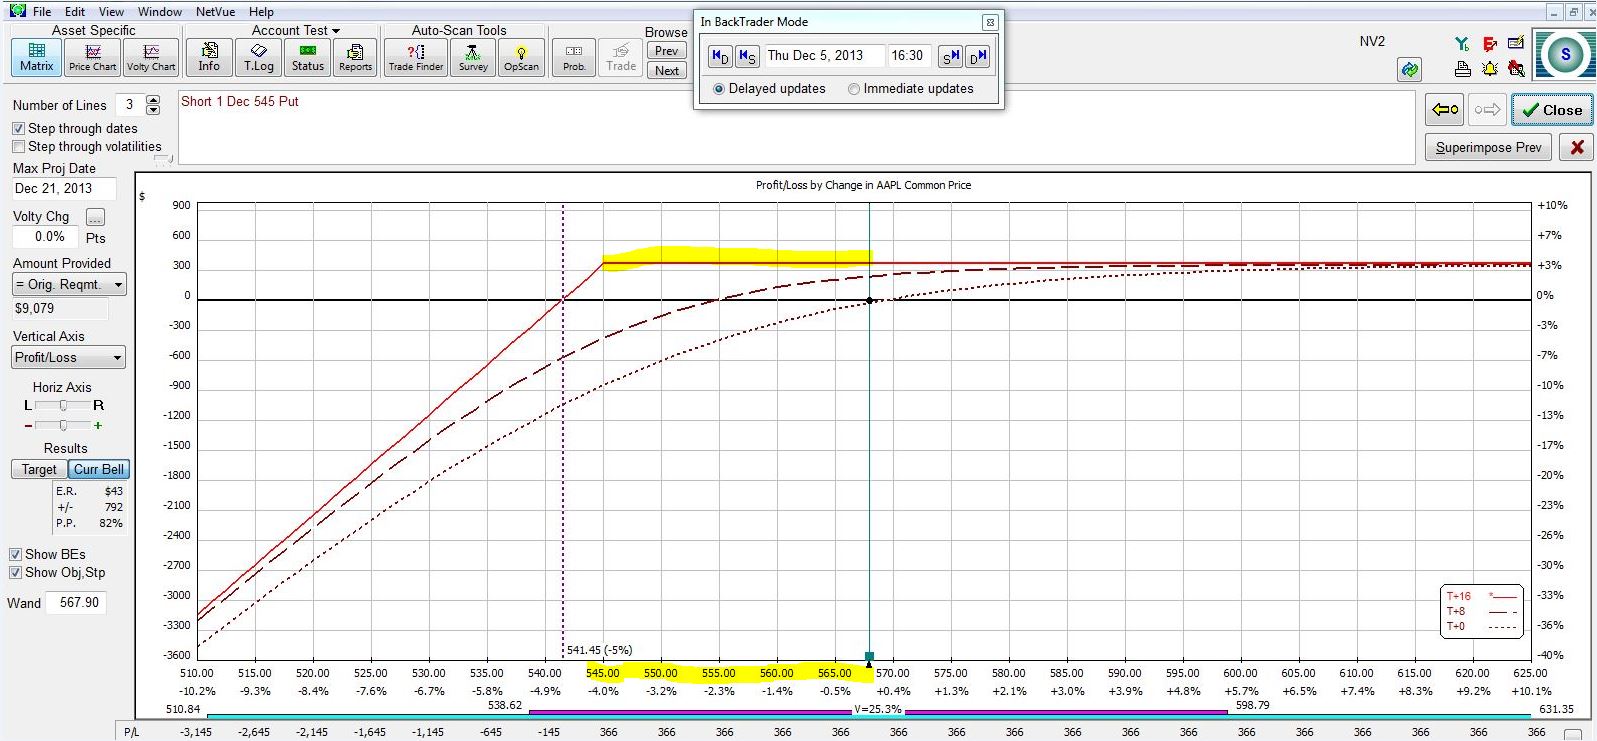
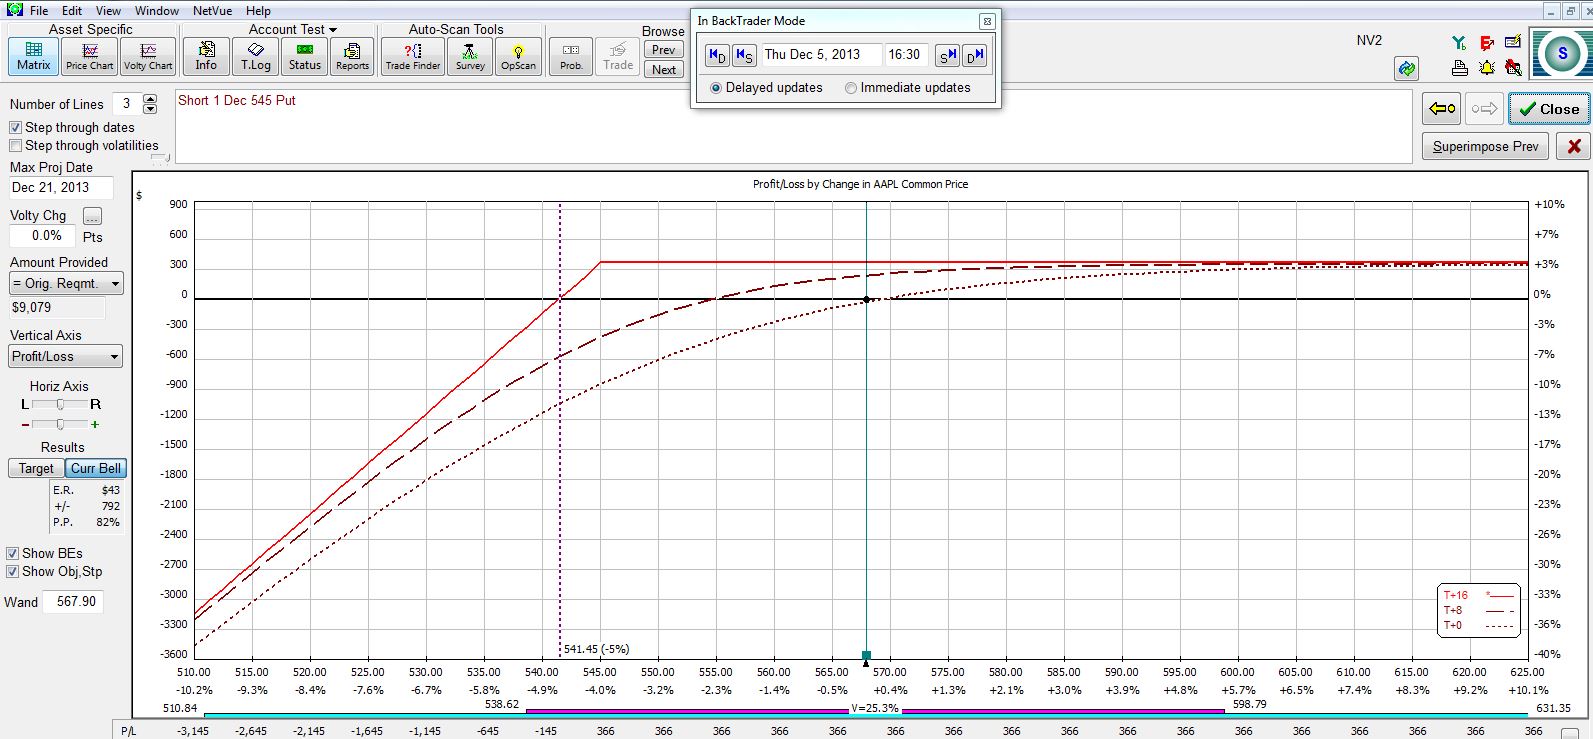
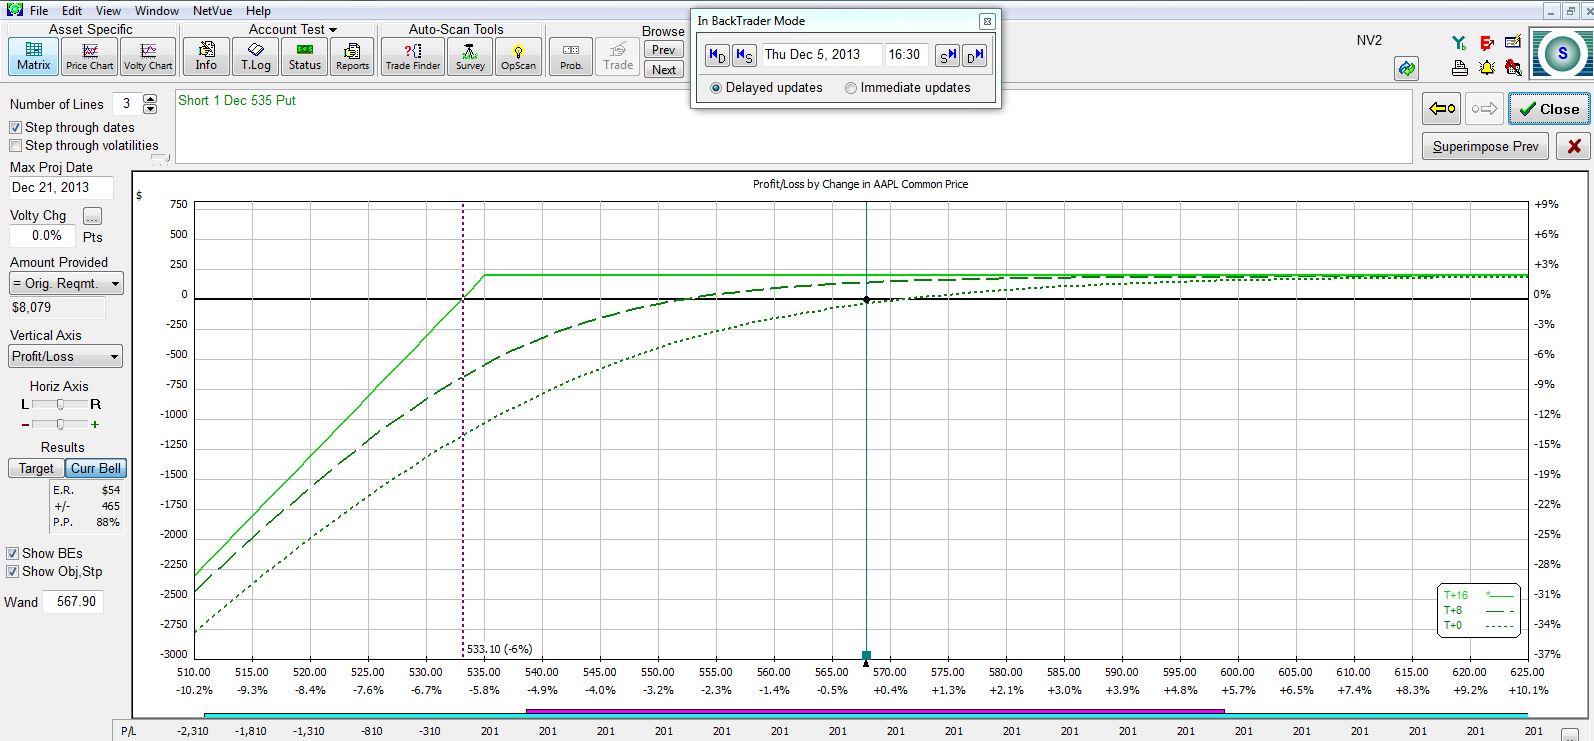
With AAPL having closed at $567.90, recall the risk graph of the 545 put:
The expiration curve (highlighted) is the PnL at option expiration, which is 16 days into the future. Note how the stock can fall in price yet the CSP position still posts full profit. The put strike price of $545 means the option will expire worthless if AAPL is above $545 at expiration. In order to lose money, the stock must fall even farther to offset the money collected from the put sale. The total downside protection is therefore about $26.40.
Not having to be correct about market direction represents a great advantage to trading CC/CSPs rather than long stock. Sixteen days from now, if AAPL stock has fallen no lower than $545 then the stock position loses money while the CC/CSP position makes full profit. In a previous post I discussed a roaring bull market as disadvantageous to CC/CSP trading because the CC/CSP underperforms with its full profit. Is this disappointment more than offset by how good CC/CSP traders feel when the market declines and these positions still generate that full profit?
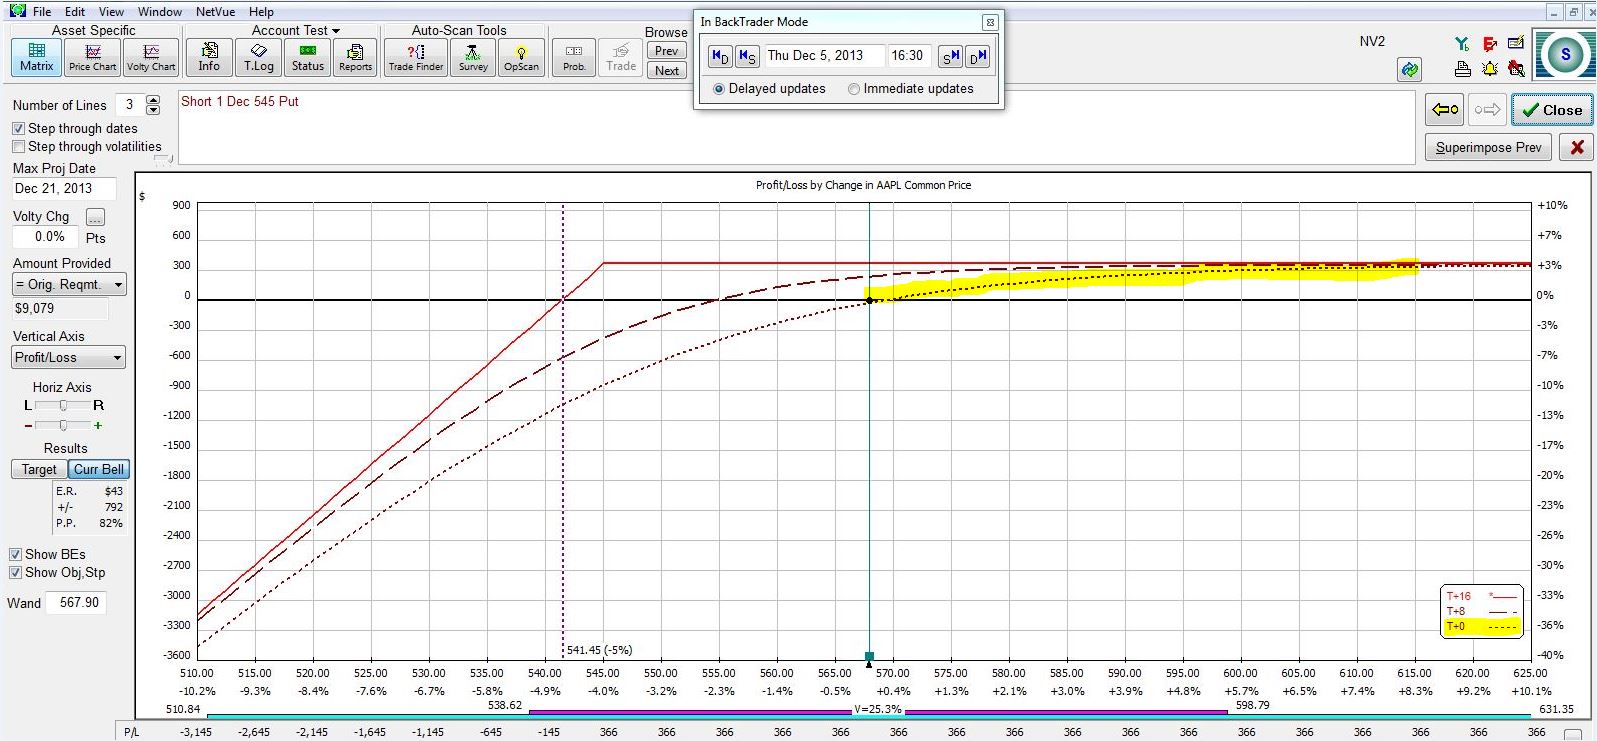
Make no mistake, though: the CC/CSP is still a bullish trade:
The T+0 curve (highlighted) represents today’s PnL. Note how the curve slopes upward to the right. If the stock goes up (down) today then this position makes (loses) money. While I make full profit on the position if AAPL has lost less than $22.90 in 16 days, if AAPL goes down today then I will feel some pain. Human nature suggests the faster AAPL stock declines, the more angst I will have over this position. Depending on my portfolio and trading plan, simply waiting until AAPL hits $545 may not be the best choice; if that happens today then I will lose at least twice what I could potentially make and probably a lot more because IV would substantially increase.
More considerations about the CC/CSP trade in my next post!
Categories: Option Trading | Comments (1) | PermalinkCovered Calls and Cash Secured Puts (Part 13)
Posted by Mark on December 6, 2013 at 07:17 | Last modified: January 21, 2014 09:19The current blog series has been detailing different aspects of the covered call (CC) and cash secured put (CSP) trade. Today I will continue by addressing moneyness of the short option.
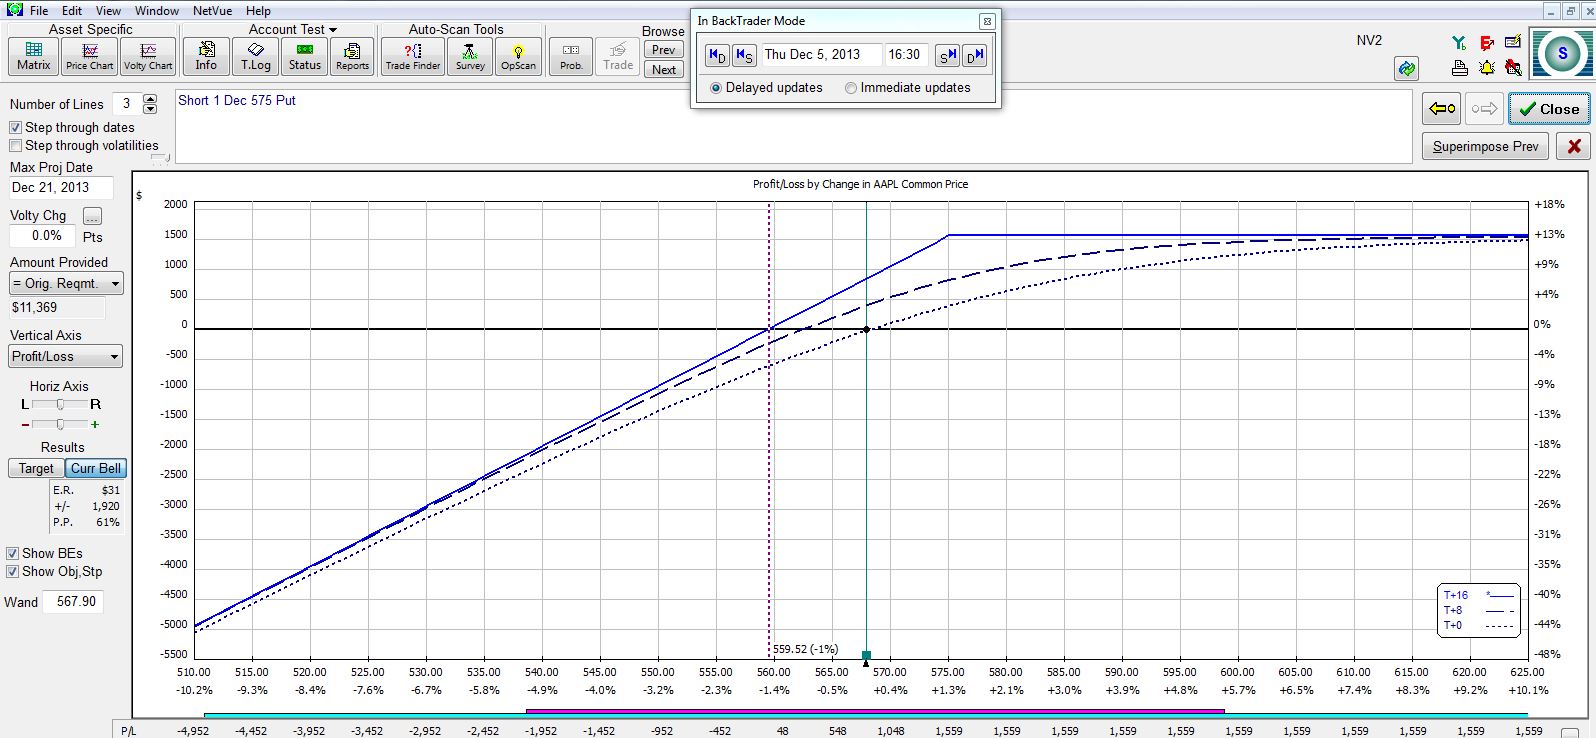
Moneyness is the relative position of the current price of a stock with respect to the strike price of the option. Consider AAPL stock, which closed yesterday at $567.90. If I wanted to trade a CSP then I might sell an in-the-money put at the $575 strike:
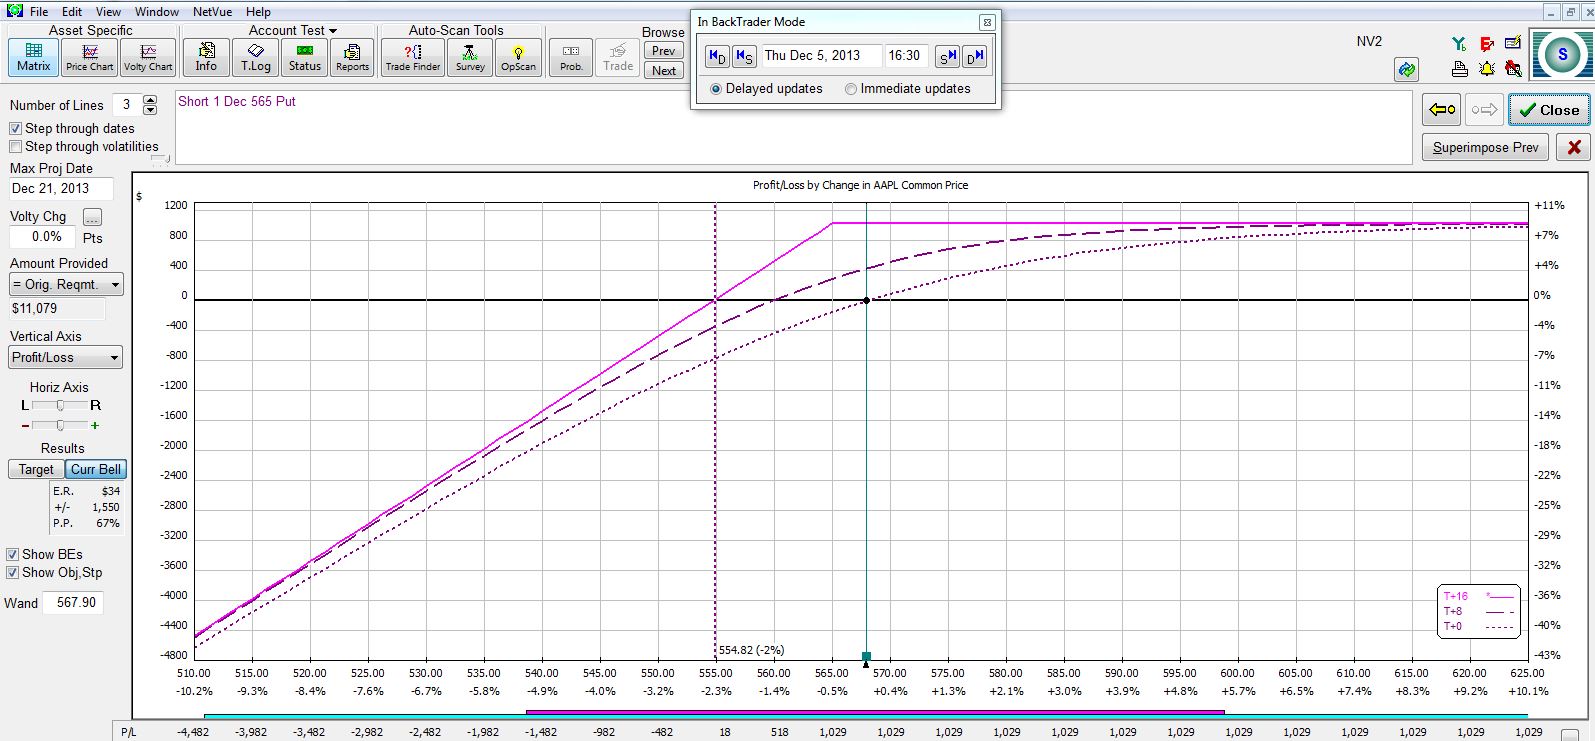
Here is a near-the-money option at the $565 strike:
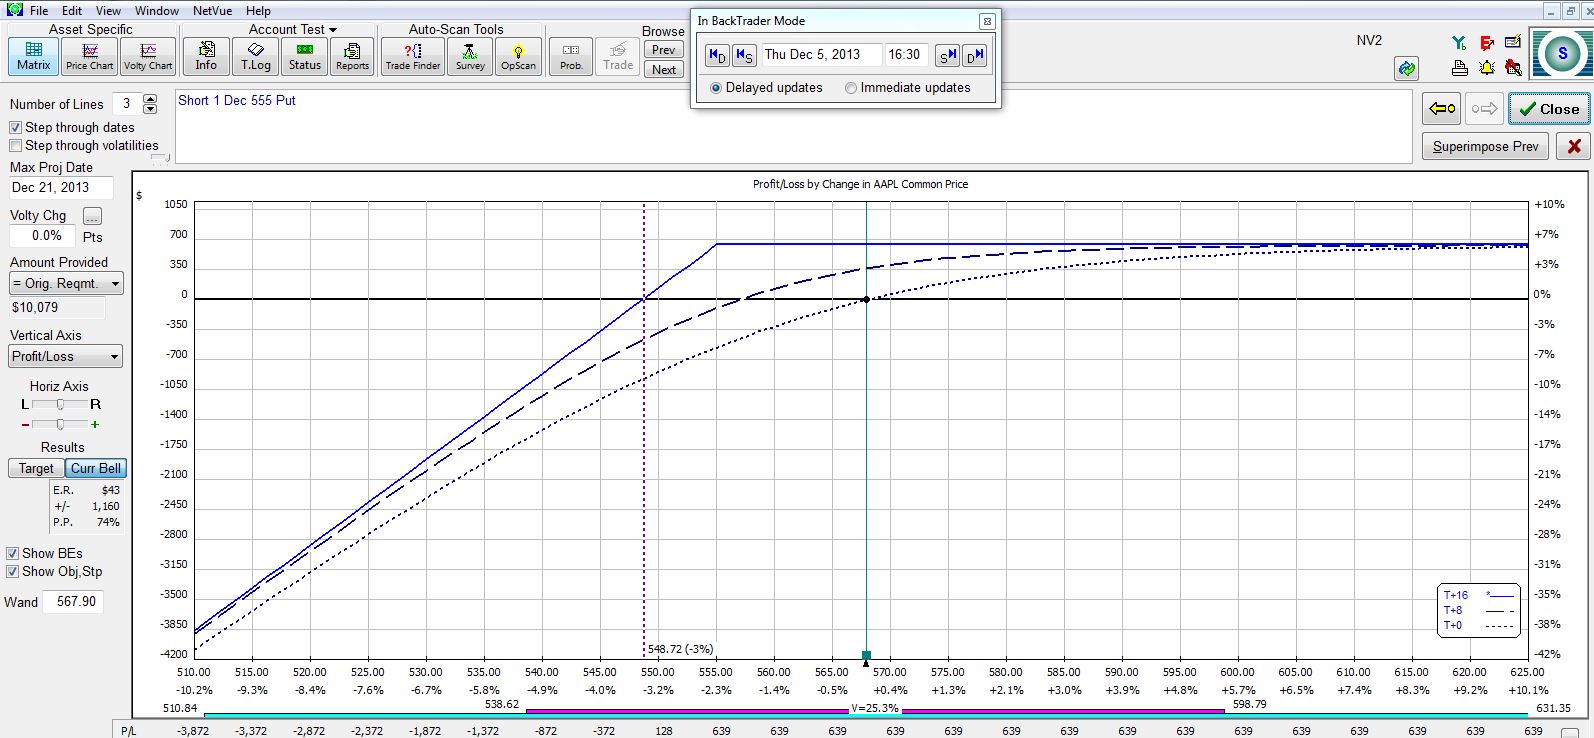
Here is an out-of-the-money (OTM) option at the $555 strike:
Here are farther OTM options at the $545 and $535 strikes:
Which is best? There is no right answer.
What I need to understand if I’m going to do this trade are the relevant tradeoffs. The farther OTM I go, the greater my probability of profit (POP) and the less profit I can expect to make. Here is a summary of the four trades:
The farther OTM I go, the larger my POP and the smaller my potential profit.
The larger my POP, the greater my downside protection. At the breakeven stock price (second column in the table), my profit on the trade will be zero at expiration.
If I think the stock might fall then I may seek a higher POP, lower breakeven, and lower potential profit.
If I think the stock might rally then I may accept a lower POP and less downside protection in exchange for a higher potential profit.
These are some of the considerations to be made when designing a CC/CSP trading plan.
Categories: Option Trading | Comments (3) | PermalinkOption Volatility and Pricing (Part 3)
Posted by Mark on December 3, 2013 at 05:39 | Last modified: January 20, 2014 13:06In my last post, I outlined a backtesting methodology to determine whether stock movements are Normally distributed. Even without the backtest, I can say that many do not believe stock movements to be Normal.
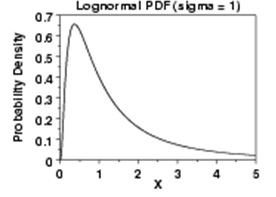
Rather, many people believe stock price movements to be lognormally distributed. This means the logarithm of price movements is Normally distributed rather than the price movements themselves:
This is a minor detail because the lognormal distribution is one step removed from Normal. Lognormal arguably fits price movements better because like stock price, the lower bound is zero. Furthermore, when the continuously compounded returns of a stock follow a Normal distribution, the stock prices themselves follow a lognormal distribution.
Many option pricing models such as Black-Scholes actually assume a lognormal distribution of stock price changes.
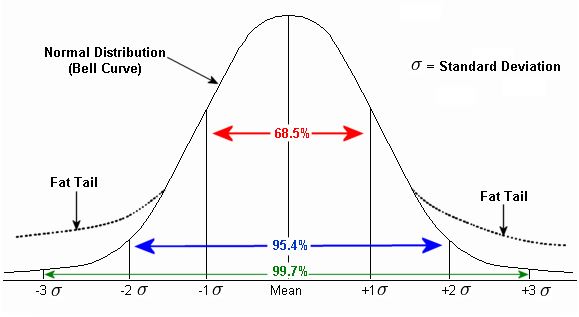
A second challenge to Normally distributed stock movements is the widely-held belief in “fat tails.” This is illustrated below:
The claim here is that a relatively high number of returns fall outside the Normal distribution. In other words, 99.7% of all these returns are not ±3 SDs of the mean. “Black swan” events are examples of fat tails. A 4 SD price move should not occur more than once every 15,787 trading days (62 years), yet every earnings cycle we see this occur semi-regularly. These abnormal returns provide evidence of extended moves, outsized moves or trends.
Trend traders claim anyone who has followed the stock market for any length of time realizes trends can and will occur. To be fair, not all stocks trend and trends do not last forever. However, enough asset classes, major indices, sectors, or stocks are available to ensure something is trending at any given time.
Another commonly cited statistic is that most markets trend only about 20-30% of the time.
Are these claims true or is their seemingly contradictory nature proof that something doesn’t add up?
I have yet to see hard data supporting any of these claims. As discussed here, “just because something sounds good does not mean it has any necessary relevance at all.”
I think this detour has taken us far enough for now. I will refocus on the CC/CSP trade in my next post.
Categories: Option Trading | Comments (0) | PermalinkOption Volatility and Pricing (Part 2)
Posted by Mark on November 27, 2013 at 06:12 | Last modified: January 20, 2014 09:35In my last post, I took a detour to explain some basics about option pricing and volatility.
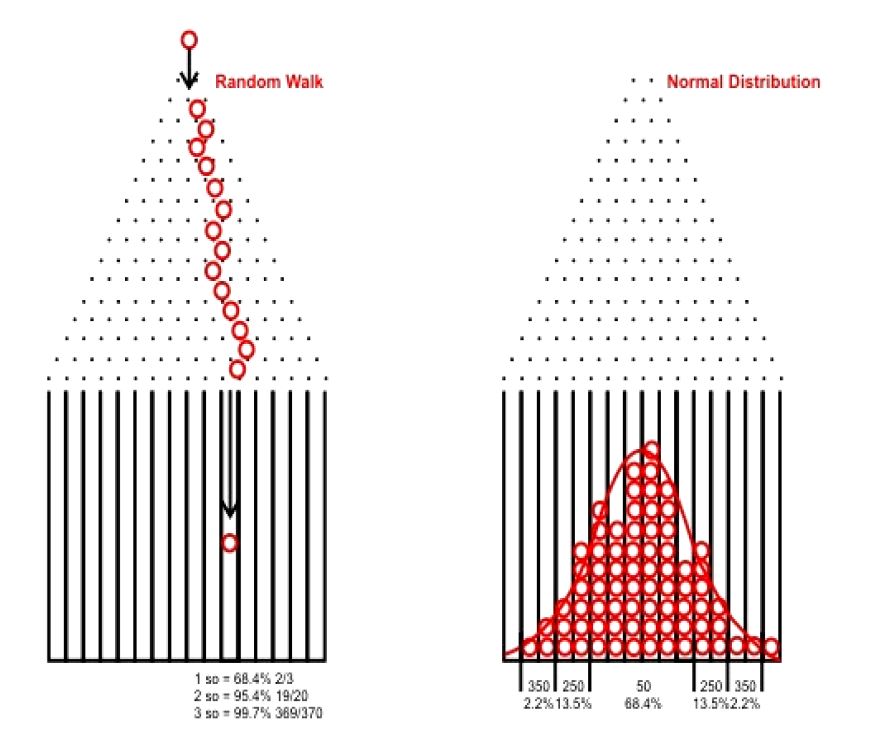
In that discussion, I showed an experimental 100-trial simulation of the Price and Right “Plinko” game, which simulates a random walk. If we run many such 100-trial simulations and combine the results then we will see something like this:
These chips are much like stocks, which have a near-equal chance of going up or down on any given day. Most option pricing models assume future stock price to be distributed in this fashion. Since people trade based on these pricing models and since trading theoretically affects price movement, it seems logical that future prices will more or less follow the Normal distribution (bell curve as shown above).
As I write this, two questions pop into mind.
First, do stock prices really follow these tendencies?
We could conduct a backtest to answer this question. We might randomly select a large number of stocks and note the average IVs. We could then look at price changes over a predetermined time interval and convert those to SDs. If the theory holds then the SD distribution should approximately follow the bell curve.
This backtest is much easier said than done. We might want to look at some different market environments. We might want to diversify across sectors or asset types. We should be sure to include stocks that have become worthless (corporate bankruptcies). The considerations are numerous.
Assuming the bell curve is an accurate description for stock movement, my second question is whether that movement is randomly distributed because of the pricing models or are the pricing models as they are because of the way price movements distribute? This is a “chicken or the egg” question that may not have an answer.
I will continue this discussion with my next post.
Categories: Option Trading | Comments (1) | Permalink