Backtesting Methodology (Part 1)
Posted by Mark on November 13, 2015 at 06:44 | Last modified: October 31, 2015 12:41I don’t feel the backtesting statistics do the data justice without some explanation of the study methodology.
One of the most common approaches I have seen to option backtesting is to start trades on a particular day. I have seen people start backtested trades with 45 days to expiration, 36 days to expiration, or on the first trading day of every month.
One potential problem I see here is insufficient sample size. Traditionally, people could go back a number of years with a backtest and only have a sample size equating to 12 times the number of years. More recently with weekly options, sample sizes can be 4+ times greater but only if the strategy is a weekly strategy. Because WeeklysSM are considered by many to carry excessive risk, I believe monthly trades are much more common.
Exactly what is an adequate sample size, then? I’ll go with: 1. I don’t know; 2. It depends (on the particular situation). I really want to lean toward the latter and say “whatever sample size is sufficient for statistical significance.” The question would then be whether a statistically significant result is practically significant.
Based on my experience, traders are notorious for using insufficient sample sizes in backtesting and live trading. I’ve seen plenty of people backtest a monthly option trade for 1-3 years. With 12-36 occurrences, this hardly strikes me as sufficient! Perhaps my favorite example comes from traders trying to apply technical analysis (TA). For example, this comes courtesy of the Twittosphere (names blacked out to protect the “innocent”):
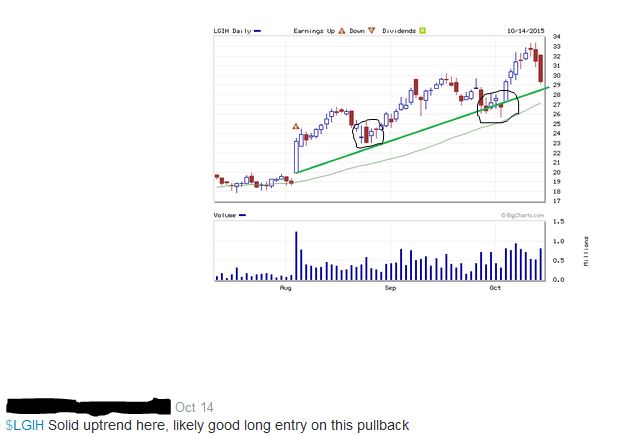
Obviously (according to TA) the long trade is “likely good” here because each of the previous times the stock has pulled back to the positively-sloped green line, it has moved higher. How many times was that? Look closely to make sure you count them all (circled): one, two… TWO!
Oh wait… only two?
How many days does it take to make a habit: 21? 30? 66? Certainly not two… you get the idea.
But wait: there’s more! I will continue in the next post.
Categories: Backtesting | Comments (1) | PermalinkNaked Calls
Posted by Mark on November 10, 2015 at 07:14 | Last modified: October 31, 2015 12:18I have spent many hours backtesting naked calls and I now want to analyze these data. The question I ultimately look to answer is whether this trading approach offers any edge.
I backtested from January 2, 2001, through September 21, 2015: 3,695 trades total.
74.7% trades (2,760) won.
25.3% trades (935) lost.
Mean days in trade was 24.39 with a standard deviation of 11.87.
Mean profit on 2,760 trades was $2,994.65 with a standard deviation of $835.
Mean days in winning trade was 25.92 with a standard deviation of 11.12.
Mean loss on 935 trades was $9,601.91 with a standard deviation of $3,420.
Mean days in losing trade was 19.87 with a standard deviation of 12.82.
Average trade: -$192.84
Average annual loss: -$2,886.20
Profit factor: 0.92
To say “this does not seem very encouraging” is understatement of which even Ernest Hemingway would be proud.
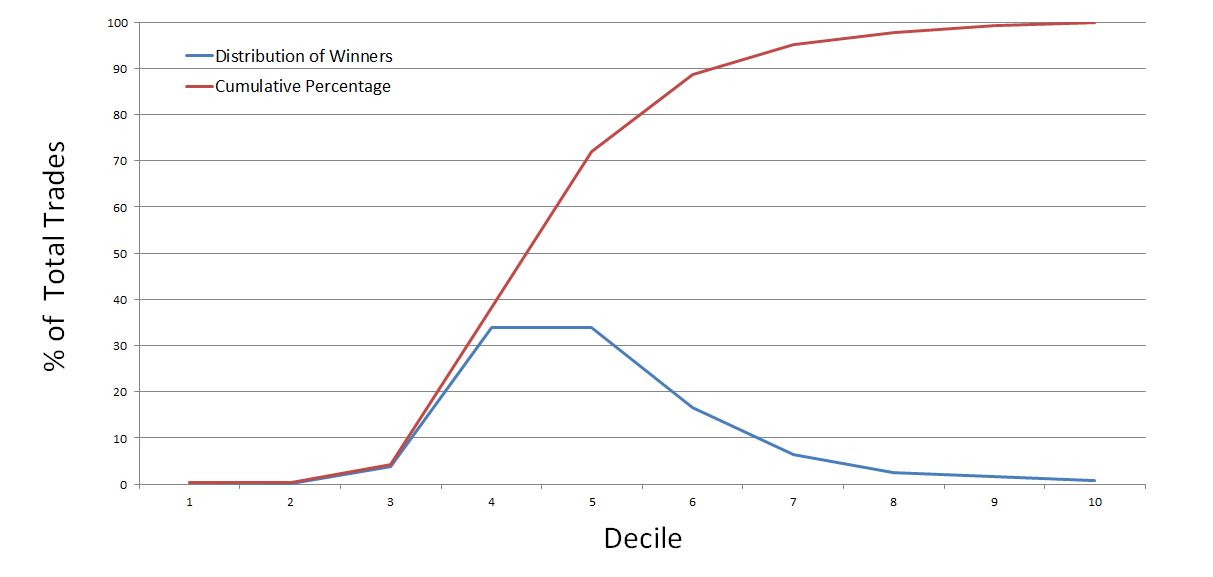
The graph below shows the distribution of winning trades:
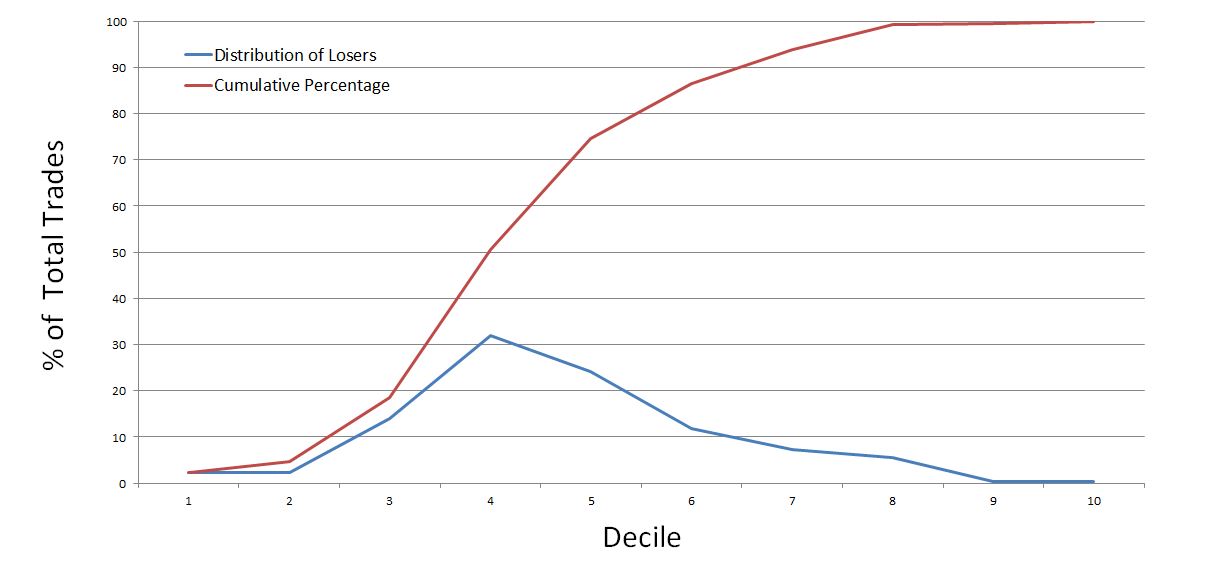
The graph below shows the distribution of losing trades:
Do you see anything here that might offer even the slightest of hope?
I do find it interesting that the four deciles of largest losses (in excess of $13,584 per trade) account for less than 14% of the losing trades.
Intuitively, I’d like to see this significantly larger than the four deciles of largest gains (in excess of $4,624 per trade) but those account for a comparable amount at 11.4% of the winning trades.
A couple other observations further dim the light on hope. First, the losses are not maximum adverse excursion (MAE): the practical statistic that really matters. Second, it’s important to note this was an end-of-day backtest, which means results can be lumpy. A trade can go from decile 2 to decile 7-10 in a single day.
I may run the MAE analysis later but I really have little hope for a system with a negative expectancy to start (profit factor < 1.0).
Categories: Backtesting | Comments (3) | PermalinkPaper Trade 1 (Week 3) (Part 2)
Posted by Mark on September 30, 2014 at 05:08 | Last modified: February 5, 2015 07:37Yesterday, the trade described here would be closed at the profit target.
At 12:30 on Monday, Sept 29, the trade was up $2,040.
Waiting until EOD (15:30), I would have closed the trade with profit of $2,260 (11.4%).
Only two paper trades but both have been winners. This is far too small a sample size to conclude anything just yet.
Categories: Backtesting | Comments (0) | PermalinkPaper Trade 1 (Week 3) (Part 1)
Posted by Mark on September 26, 2014 at 06:50 | Last modified: February 5, 2015 07:36Yesterday Avg IV spiked about 1.8%. Being a Thursday, this meets the criteria defined here for a weekly IBF trade.
On 9/25/14, I sold 10*1140/1110/1110/1070 IBFs. MR is $19,730. Credit received was $20.71.
Profit target is $1,973 with max loss $2,959.
For T+1, max loss points are roughly 1090 and 1132.
I will monitor this way every day to see if max loss points are hit.
One concern I have is that this is the first trade in nearly two months. Perhaps I should backtest this every week to see if waiting for a higher volatility condition really makes a significant difference.
Categories: Backtesting | Comments (2) | PermalinkPaper Trade 1 (Week 2) (Part 2)
Posted by Mark on September 22, 2014 at 06:42 | Last modified: February 5, 2015 09:01Last Friday (9/19/14), this trade hit the profit target.
On Day 2 of this trade (Day 1 was EOD when it was placed), looking every 30 minutes the trade was down as much as $990 and down as little as $140.
On Day 3, the trade was down as much as $200 and up as much as $600.
On Day 4, the trade was up as little as $1,280 and as much as $2,230. I could have closed the trade at the profit target intraday but at EOD (15:30), it was up $1,780. That’s not at target so I kept it on for another day.
On Day 5, the trade was up as little as $1,250 and at 15:30, I closed it for a gain of $5,130 (27%). My preference is to close trades intraday if max loss is hit but not to close trades until EOD if profit targets are hit. I feel that biases backtesting against the trade by providing more opportunity to hit loss points. At the same time though, by realizing a 27% profit rather than 10% profit (target), this is biased for the trade–maybe the two effects cancel each other out.
Only with enough occurrences will I have a better idea about this.
Categories: Backtesting | Comments (0) | PermalinkPaper Trade 1 (Week 2) (Part 1)
Posted by Mark on September 16, 2014 at 07:42 | Last modified: February 5, 2015 08:25Yesterday, Avg IV increased from 16.3% to 17.1% on a second consecutive 10-point down day. This is not the magnitude for a 1-day volatility spike I originally described as a criterion for taking the trade.
The main issue I’m having is a low number of occurrences. If I take this trade then it’s only the second trade in 1.5 months. At that rate, it will take 75 months–over six years–for me to get 50 trades (a small but probably acceptable sample size). Another problem with the infrequent trades is that it can’t be counted on as a consistent income generator.
I could do a couple things to increase the number of occurrences. First, I can allow for Monday trades rather than Tuesday through Thursday only; that is something I am doing here. I originally excluded Monday trades because Avg IV usually expands on Monday since the tradeless weekend has passed; this can distort Avg IV change data. Second, I could look for more than a 1-day IV spike. If IV increases 0.8% one day and 1.2% the next then that’s a 2.0% spike in two days, which is a lot. Neither would meet the “roughly 2.0% or more on one day” criterion, though.
Another thing I might have to consider is taking all trades just to see how the trade generally performs. If the trade is only profitable when IV spikes then it’s an opportunistic, occasional trade. My preference would be one I could place regularly, though. There may or may not be such a thing as that “consistent” trade that is a reliable profit generator. I’m skeptical.
Yesterday, I would sell 10 * 1180/1150/1150/1110 IBF for a credit of $21.44/contract. MR is $19,000 so the profit target is $1,900 and max loss is $2,750. At T+1, these would be hit at 1129 and 1170. I will continue monitoring accordingly.
Categories: Backtesting | Comments (1) | PermalinkPaper Trade 1 (Week 1) (Part 2)
Posted by Mark on August 5, 2014 at 06:20 | Last modified: February 3, 2015 09:33This first trade worked out profitably.
On 8/1, the trade was down 1330 at 10:30 AM (RUT 1107.4).
The trade was up 270 by EOD Friday.
At the open yesterday, trade was up 2350 (RUT 1119.1).
At 15:30 yesterday, trade was up 4520 (RUT 1124).
I’ve had thoughts to close trade at max loss intraday but to take profits at EOD only. I’ll track both possibilities. Were I to have taken profits intraday, I would have done so at the open (~11%).
Categories: Backtesting | Comments (0) | PermalinkPaper Trade 1 (Week 1) (Part 1)
Posted by Mark on August 1, 2014 at 06:36 | Last modified: February 4, 2015 10:49I apologize for the generic title of this blog post! This corresponds to a RUT weekly iron butterfly trade.
The trading plan is as follows:
–Place trade on Tues-Thurs when Avg IV spikes roughly 2% or more
–Sell 30-point call credit spread ATM
–Sell 40-point put credit spread ATM
–Close trade if profit reaches 10%
–Close trade if loss reaches 15%
I will include transaction fees of $11/contract.
On 7/31/14, I sold 10*1150/1120/1120/1080 IBFs. MR is $18,730. Credit received was $21.71.
For T+1, max loss points (-$2800) are roughly 1098 and 1143.
I will monitor this way every day to see if max loss points are hit.
Categories: Backtesting | Comments (5) | PermalinkCovered Calls and Cash Secured Puts (Part 27)
Posted by Mark on February 7, 2014 at 05:29 | Last modified: February 3, 2014 07:33My last post included a backtested example illustrating why rolling is not a risk-free panacea for CC/CSP positions. Did the RO & Up adjustment for a debit truly violate MacDuff’s guidelines?
One thing I find debatable about the annualized adjustment calculations presented in the last post is whether to account for the change in strike price. One of MacDuff’s guidelines is that every adjustment should be done for a credit [ideally at a 15% annualized rate of return]. With MSFT at $20.99, I rolled the May(22) 20 call to Jun(57) 21 call for a debit of $0.24 (including commissions).
Usually when the RO & Up is performed, the strike price is moved OTM to reduce assignment risk. Because Nobody Knows whether the stock will reach the new strike at option expiration, I would not add the change to the return calculation.
In the MSFT example, however, the RO & Up adjustment moved the strike price from ITM to ATM. While I still agree that Nobody Knows whether the stock will reach the new strike price at option expiration, the stock is already there after the adjustment! More specifically, what I am adding to the return calculation is the difference in intrinsic value of the short call because this decrease represents money in my pocket right now:
-$0.24 (including commissions) + $0.99 = $0.75 on the roll for an additional 57 – 22 = 35 days. That amounts to an annualized return of 30.34%.
This seems like a useful rule of thumb by which to determine whether a roll is worth doing especially if the position is profitable. When profitable, the other possibility is to take assignment: “nobody ever went broke taking a profit”
If the position is underwater like the MSFT example, though, then MacDuff says we have no choice but to continue fighting because we should never lock in a loss. In that case, my goal is just to continue rolling out and/or up until the strike price exceeds the cost basis of the trade.
I will continue this debate in my next post.
Categories: Backtesting, Option Trading | Comments (0) | PermalinkCovered Calls and Cash Secured Puts (Part 26)
Posted by Mark on February 4, 2014 at 07:02 | Last modified: February 1, 2014 06:05I left off discussing the risk of compounding loss when using the RO & Up adjustment. Today I will illustrate with an example.
This CSP position begins on January 29, 2008, by selling a Jul(132) $32.50 put on MSFT (trading at $32.55) for $2.28. The credit received provides 7.21% of downside protection and a potential annualized return of 19.40%. This satisfies my variation of the Math Exercise, which is to accept at least 5% of downside protection rather than MacDuff’s 12-15%. I have encountered great difficulty finding stocks that meet the latter criterion in addition to the 15%+ annualized return.
With the market in decline over the next 14 months, I took assignment of the shares and then sold CCs against the stock. I had to roll down three times through March 2009 expiration. On March 23, 2009, the stock chart looked like this:
 (2-1-14)")
On this day, I rolled down for a fourth time:
")
The stock had already found a bottom and over the next month, it moved sharply higher. On April 24, 2009, I made the following RO & Up adjustment:
")
The position is down $527 and I’m fighting to keep the short call OTM. With this trade, I bought back the May 20 call for $1.33 and sold the Jun 21 call for $1.11. I therefore spent money on this adjustment, which is a violation of the guidelines. Ideally I want to take in money with each adjustment at a 15% annualized rate of return or better.
What if I sold the Jul(85) $21 call for $1.42? The credit on this roll would have been $0.31. The annualized rate of return for this adjustment would have only been 6.87%, however.
What if I sold the Oct(176) $21 call for $2.17? The credit on this roll would have been $1.06 but the annualized return would have only been 9.62%. The longer-dated call would not decay as fast as the Jun or Jul call either. This means if the stock continued to rally then I could quickly run out of expiration months for rolling.
I will continue discussion of this example in my next post.
Categories: Backtesting, Option Trading | Comments (1) | Permalink