Musings on Put Credit Spreads (Part 5)
Posted by Mark on April 1, 2016 at 03:00 | Last modified: March 1, 2016 09:57This post does have a subtle April Fool’s joke. Do you see it?
To finish up with my clarification of Part 2:
> Dream of the Holy Grail remains alive and demand to
> purchase the education in hopes of profitable trading
> is directly proportional to marketing efficiency.
If I have spent money to join a trading program or community then confirmation bias may predispose me to believe in it. As a consequence, I may search for evidence that it works and ignore any suggestion to the contrary. This could also involve future leaks (discussed in last post). Marketing efficiency (e.g. fallacy of the well-chosen example) may determine whether I become sold on the program in the first place.
Since I am completely disorganized in this series of blog posts, let me toss in a mention of Charles Cottle. In Parts 2 and 3 I discussed how complex spreads are often combinations of simpler units. Cottle talks a lot about this in his writing.
Now then, I will finally return to discussion about a methodology for backtesting put credit spreads. I will sell the first option under 9.90 delta or below to account for plasticity in the matrix greeks. The option to buy will be 10 points OTM. I will use $64 slippage per spread round turn.
Looking at two arbitrary dates, in 2010 at 637.55 with 46 DTE the vertical spread just described fetches $0.65 whereas in 2004 at 397.44 with 47 DTE this spread fetches $0.40. The differential between the two is not as much of a concern as the fact that slippage alone will completely negate the credit.
Houston, we have a problem!
One solution would be to decrease the slippage. Lately I have been finding $0.10 for a $3.00-$4.00 option is not unreasonable. On a spread that could be $0.20, which is $42 round trip (34% less).
A second solution would be to use the “last” prices instead of the “mid.” If the option traded at that price before then it seems reasonable I should be able to get that price again. One problem would be if I were selling (buying) a spread and the “last” quotes reflect purchase (sale) of that same spread, which would result in an artificially increased (decreased) price. I would never be able to tell what side the “last” was on. Another problem is that the “last” can be very stale if the option has low volume.
I will continue piecing together these backtesting guidelines in the next post.
Categories: Backtesting | Comments (2) | PermalinkMusings on Put Credit Spreads (Part 4)
Posted by Mark on March 29, 2016 at 07:47 | Last modified: March 1, 2016 09:02I begin by concluding some analysis of a Tasty Trade (TT) segment from February 9, 2016. I hope to take bits and pieces from this analysis and apply them to my backtesting methodology for put credit spreads.
Aside from mixing different strategies, a second problem I have with the TT research involves duration. All capital should be recycled in roughly 45 days. The tested trades were rolled for an average 35-day increase in duration. I therefore have to position size assuming 80 days in trade. This will significantly dilute returns.
Given a binary choice between diluted returns and win/loss then intuitively, I would choose the former. In addition to increased comfort, lower drawdown (DD) could mean increased position size to somewhat compensate for diluted returns. In backtesting this, I would have to be mindful of maximum DD since these positions are of the “unlimited risk” variety (the TT presentation did not include any DD data).
Continuing with the previous post’s clarification of Part 2, I also wrote this mouthful:
> This is partly why I believe the appeal to complex trade
> methodologies including multi-legged positions… is
> misguided. Large degrees of freedom significantly
> complicates backtesting: curve-fitting or small sample
> sizes muddle the interpretation.
This is called the “curse of dimensionality.” More parameters mean more categories for comparison. With a finite amount of data, this means fewer points in each category. These sample sizes may become insufficiently small and any identifiable conclusions may be curve-fit or fluke rather than representative of a large population.
> People think they are objectively backtesting while future
> leaks and free-range confirmation bias inconspicuously
> oppose them.
A future leak is when knowledge of the future contaminates calculation in the present. Realistically, this can never happen when trading live. I often hear about option traders backtesting trading strategies over recent months. They know exactly where the market is going so the guidelines are less likely to work when the market environment changes.
I see confirmation bias in much of the arrogant, ego-driven talk that I often write about. People present trading strategies that they are determined to defend as if their very lives depended on it. Why?
That’s a whole other blog post.
Categories: Backtesting | Comments (1) | PermalinkMusings on Put Credit Spreads (Part 3)
Posted by Mark on March 24, 2016 at 07:04 | Last modified: February 29, 2016 11:06Congratulations are in order if you followed the entirety of my last post. In going back to reread later, I got so confused that I decided to spend some time clarifying.
The straightforward understanding advanced traders have of multi-legged spreads like iron condors and butterflies may be illusory. Not only does design of a spread backtesting approach reveal multiple parameters to consider, trying to execute these beasts in real-time crash conditions can prove detrimental to financial health.
For this reason I prefer backtesting of elementary rather than combinatorial trading systems.
In the last post I wrote:
> Adjustments present like a fly in the ointment. If these are actually new trades
> then why backtest them together as opposed to closing one trade, starting another
> one, and combining the results?
I have reservations about a February 9, 2016, Tasty Trade presentation where a naked put trade is compared to a favorable adjustment strategy rolling the tested put out in time. Two strategies are being combined in a somewhat-arbitrary fashion: an OTM naked put and an ATM [rolled] naked put. Only a fraction of the occurrences required rolling and the positive performance of those ATM puts might be a fluke.
Viewed another way, the rolled put will be profitable if volatility trades sideways or lower. Volatility always mean-reverts but live-trading requires capital allocation around a volatility stop beyond which I will have no capital left for additional trades [rolls]. “Trading small” marginalizes this practical concern because it implies I always have plenty of capital in reserve but I question whether I could ever run a viable trading business and pay my monthly living expenses this way unless I were a multi-millionaire to begin with.
The Tasty Trade team did allow for only one roll but they did not give a maximum drawdown analysis, which would help to better assess the viability of rolling.
In addition, I certainly believe the OTM and ATM naked put trades should be backtested independently in large sample size to get a clearer understanding of performance.
Categories: Backtesting | Comments (0) | PermalinkMusings on Put Credit Spreads (Part 2)
Posted by Mark on March 22, 2016 at 07:14 | Last modified: February 29, 2016 09:14Last time I summarized my progress analyzing naked puts and addressed my biggest concern. One possible antidote to undefined risk is an option spread but backtesting spreads presents an array of challenges.
The simplest spreads are vertical or horizontal. Beyond that, we have:
- Diagonals
- Butterflies
- Iron Condors
- Double Diagonals (i.e. “Straddle-Strangle Swap”)
- Ratio Backspreads
A complex spread is a combination of simple spreads and/or a single option(s). For backtesting purposes, I wonder whether the separate legs must be combined as they were historically or whether this is too deterministic. In case of the latter, I should randomize the combinations and study a simulation of many more possibilities in true Monte Carlo style.
I’m talking a violent disruption to the conventional order, here…
Thankfully, I believe price interaction is a decent argument for keeping historical spreads intact. For example, consider a liquid put vertical spread that is one strike wide. With 30 days left to expiration, I would never see a three-fold increase in short put premium with a concomitant 90% decrease in the long put. For this reason it makes sense to keep them together and this should apply no matter how many legs in the spread.
I still remain leery about complex trade methodologies. These are trades with multiple legs and various [discretionary] adjustment guidelines. Target option deltas can vary as can margin requirements, PnL targets, etc. Adjustments present like a fly in the ointment. If these are actually new trades then why backtest them together as opposed to closing one trade, starting another one, and combining the results?
This is partly why I believe the appeal to complex trade methodologies including multi-legged positions with eye-popping marketing names is misguided. Large degrees of freedom significantly complicate backtesting; curve-fitting or small sample sizes muddle the interpretation. People think they are objectively backtesting while future leaks and free-range confirmation bias inconspicuously oppose them. Dream of the Holy Grail remains alive and demand to purchase the education in hopes of profitable trading is directly proportional to marketing efficiency.
Categories: Backtesting | Comments (2) | PermalinkMusings on Put Credit Spreads (Part 1)
Posted by Mark on March 17, 2016 at 06:26 | Last modified: February 10, 2016 07:02The biggest problem I have with naked puts is the inability to defend them in a market crash. Studying the last 15 years has given me great perspective in terms of drawdowns (DD). I must always expect a worse DD in the future, though, and it does seem like we’re seeing historic “worsts” on a semi-regular basis. The latest included two IV-popping 10+% corrections in the span of five months (Sep 2015, Jan 2016), which is a first for the 15-year time interval.
My concern about naked puts is their undefined risk nature. This means the theoretical worst could be a whole lot worse than anything ever seen. For this reason, I would definitely limit naked puts to a percentage of the total portfolio. I also find it promising to cut position size based on some sort of bull/bear regime change.
Further study is needed to determine whether a regime change would actually help. Anecdotally, significant profits seem to accrue when the market is below an X-day moving average (MA). I suspect the sharpest losses also occur below an X-day MA, though, so it may or may not make sense to limit exposure based on regime. Given my druthers, I would sacrifice profits for DD improvement and trade a smoother equity curve in larger size. This may result in a greater overall net profit.
The real kicker is that I believe position size should be held constant in trading system development. Varying position size complicates DD analysis of the equity curve because some will be apples and others will be oranges.
My study of naked puts is not complete as of the time of this writing. My last backtest fixed short delta rather than premium collected and I need to analyze those data. I am waiting to include February expiration, which has losses from the most recent market correction.
Also holding me up are the concerns described above. To that end, trading put verticals is very tempting to take the “undefined” out of undefined risk. I will continue this deliberation next time.
Categories: Backtesting | Comments (4) | PermalinkMean-Reversion Study (Part 3)
Posted by Mark on February 16, 2016 at 07:28 | Last modified: December 8, 2015 07:58The last two posts have detailed a mean-reversion study I did by making use of a price oscillator. Today I want to wrap up with some discussion.
As I pointed out, I would not conclude mean reversion from these data. If it’s mean-reverting in one direction and trend-following in the other then something else is taking place. The simplest answer seems to be volatility.
I would also make a couple observations to satisfy the curve-fitting crowd. I used 23 as the period for Osc, for MFE, and for MAE. To ensure what I saw here was not fluke, I should repeat the study for other periods (e.g. 25, 21, 27, 19, 29, 17, etc.). Similarly, I arbitrarily divided the data into 20 groups. I think it would be useful to divide into 10 groups, five, and maybe four to see if the observations are consistent. If they are then we have something. If not then it’s chaos.
Finally, given that most data were clustered around the extremes of Osc, it is tempting to use only the highest and lowest groups for the analysis. With 20 groups this is 36% of the data. With 10 or four groups this would be 44% or 68% of the data, respectively.
Categories: Backtesting | Comments (0) | PermalinkMean-Reversion Study (Part 2)
Posted by Mark on February 12, 2016 at 06:06 | Last modified: June 1, 2017 13:41Last time I described the methodology for a mean reversion study. Today I will discuss results.
The data for this study span Feb 2001 through Oct 2015.
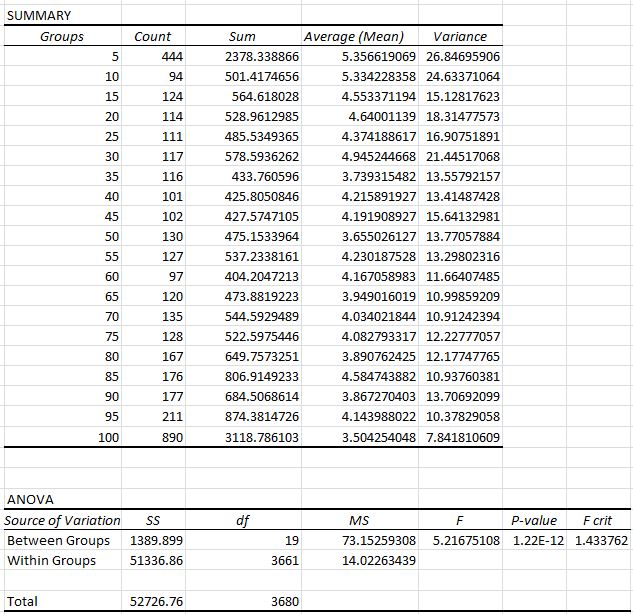
Here are the ANOVA results for MFE:
Here are the ANOVA results for MAE:
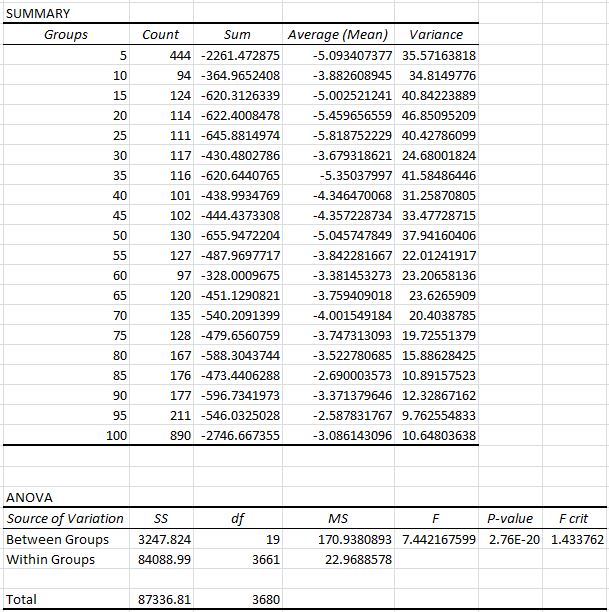
The first thing I noticed were the F-values > 5 and > 7 along with the corresponding p-values on the order of 10-12 and 10-20. Based on what experience I have in scientific research those numbers are extreme. This is probably to be expected with a large sample size (n = 3681). This tells us the averages across groups are statistically significant. Further testing would be required to determine where the differences lie, however. Some averages may differ while others may not.
Next, look at the “Count” column. The values are going to be the same for MFE and MAE because they come from the same data set. I was surprised to see the highest values at the extremes: 444 days printed an Osc reading < 5 and 890 days printed Osc > 95. This is 36% of the data in 10% of the groups. We could say this is why the market is often characterized as “taking the escalator” on the way up and “jumping out the window” on the way down: the ascent is long and gradual while the decline is often short and sharp.
Finally, the trend of both MFE and MAE values seems to decrease in magnitude as the market goes from oversold to overbought. More specifically, MFE is greatest when oversold and least when overbought. This suggests mean reversion. MAE, however, is most negative when oversold and least negative when overbought. This suggests trend-following. Taken together, we could just say the market is most volatile to the upside and downside when it is oversold and least volatile when overbought.
Categories: Backtesting | Comments (1) | PermalinkMean-Reversion Study (Part 1)
Posted by Mark on February 9, 2016 at 04:52 | Last modified: December 8, 2015 07:58Conventional trading wisdom often suggests to “sell when the market is high and buy when the market is low.” This study is designed to see if the data support such mean-reversion activity.
If I were better versed in AmiBroker Formula Language (AFL) then I could code a simple trading system and study the performance metrics. I could look at profit factor, Sharpe ratio, % winners, MDD/CAR, etc.
Unfortunately, I remain weak in that area so I turned to the old standby: MS Excel. My plan is to use inferential statistics rather than a trading system development approach.
The study methodology is as follows:
1. Start by downloading historical price information from Yahoo!
2. Create a 23-day price oscillator. The formula for this is: Osc = 100 * (C – MIN ) / (MAX – MIN)
C = current day’s closing price
MIN = lowest closing price of last 23 trading days (including C)
MAX = highest closing price of last 23 trading days (including C)
3. Create “MFE [maximum favorable excursion] next 23 trading days” with this formula: MFE = 100 * (MAX – C) / C
MAX = highest closing price of next 23 trading days (not including C)
4. Create “MAE [maximum adverse excursion] next 23 trading days” with this formula: MAE = 100 * (MIN – C) / C
MIN = lowest closing price of next 23 trading days (not including C)
5. Divide the data by Osc score into 20 groups: Osc < 5, 5 < Osc < 10, 10 < Osc < 15… 90 < Osc < 95, Osc < 100.
6. Run a single factor ANOVA to see if MFE values varied across the 20 groups.
7. Repeat for MAE values.
Will MFE and MAE differ with respect to Osc? Mean reversion would suggest that when Osc is more overbought with values toward 100, MFE and MAE values should be lower. In the other direction, mean reversion would suggest that when Osc is more oversold with values toward 0, MFE and MAE values should be higher.
I will discuss the results next time.
Categories: Backtesting | Comments (1) | PermalinkChallenges to Option Backtesting (Part 2)
Posted by Mark on January 13, 2016 at 06:18 | Last modified: November 17, 2015 16:51Earlier this year I had an e-mail correspondence about difficulties with option backtesting. My pasted excerpts made points about how stale quotes may produce misleading data, how software mechanics may lead to unreliable backtesting, and how proficiency (or lack thereof) with trade execution may affect backtesting results.
I had one particularly memorable experience with the latter point about slippage. I backtested a calendar trade over two years with and without slippage. In the former case, the trade made huge money. In the latter case, the account was ground into minced meat. This was a night/day difference between a trade I would jump to put on every single month versus a trade I would never even wish on my worst enemy.
I try to be particularly cognizant of transaction fees when I backtest. I would rather estimate transaction fees too high than too low when looking at a trade I might actually do with real money.
One thing I have learned in the years since studying that calendar trade is the profound effect of sample size. I believe minor inaccuracies (also known as “random error”) here and there will be averaged out with a large number of occurrences. Put a different way, the more occurrences I have to study, the larger will be the signal-to-noise ratio. If a trade has worked in the past then I will be more likely to detect it.
As long as I am reasonable with regard to slippage, backtested results will give me the confidence to trade with real money. No methodology to trading system development will ever be perfect. At the end of the day, the ultimate goal must therefore be having the necessary confidence to trade it live and to stick with it during expected drawdowns to emerge profitable on the other side.
Categories: Backtesting | Comments (0) | PermalinkChallenges to Option Backtesting (Part 1)
Posted by Mark on January 12, 2016 at 05:18 | Last modified: November 13, 2015 15:28I had an exchange with another trader some months ago about option backtesting. I wanted to copy and paste parts of my last response because they are good things to keep in mind:
“Greeks do lie sometimes… I was just on the phone
with OptionVue (OV) discussing a position I was
studying… between 10:30 AM and 11 AM yesterday.
Greeks suggested a market rally and volatility
contraction would increase cash flow when cash
flow significantly decreased. The back month
option in the spread had no volume change over
that 30 minutes so without any volume that may
have been a stale quote. This is another
potential contaminant to accurate backtesting…
One thing that has frustrated me over the years
with OV is that I can open a matrix and get
identical prices but different greeks simply by
refreshing the data, which I suppose forces the
program to recalculate modeled values. If I’m
looking to sell nothing greater than a 10 delta,
for example, then a 10.4 versus 9.8 delta
simply as a result of refreshing the data means
the backtest is not reliable: one option may
land a winner and the other a loser. This is
another argument in favor of a large sample
size because if small then the difference
between a winning trade and a losing one can
be very significant in the totality of results…
Just this morning I was reading a trading forum
and I found this post:
> I have found backtesting options strategies
> to be very difficult mainly due to the large
> bid/ask spread.
> If, in your backtest, you always use the
> worst price, the strategy will never
> make money. If you use the best price
> then your probability of success is
> artificially inflated.
> Backtesting options strategies is very
> hard, and the results given by most
> websites and/or software seems to always
> show the best case scenario. Most of the
> time this is not happening
This really hit home. I’ve encountered this for
years and I totally agree.”
I’ll finish up with the next post.
Categories: Backtesting | Comments (0) | Permalink