Undressing Negative Gamma Risk
Posted by Mark on April 27, 2012 at 13:42 | Last modified: April 27, 2012 13:46It’s rumored that fear and greed are the two emotions that drive markets. As an options trader I would argue that psychic pain, otherwise known as negative gamma risk, should be listed as the third.
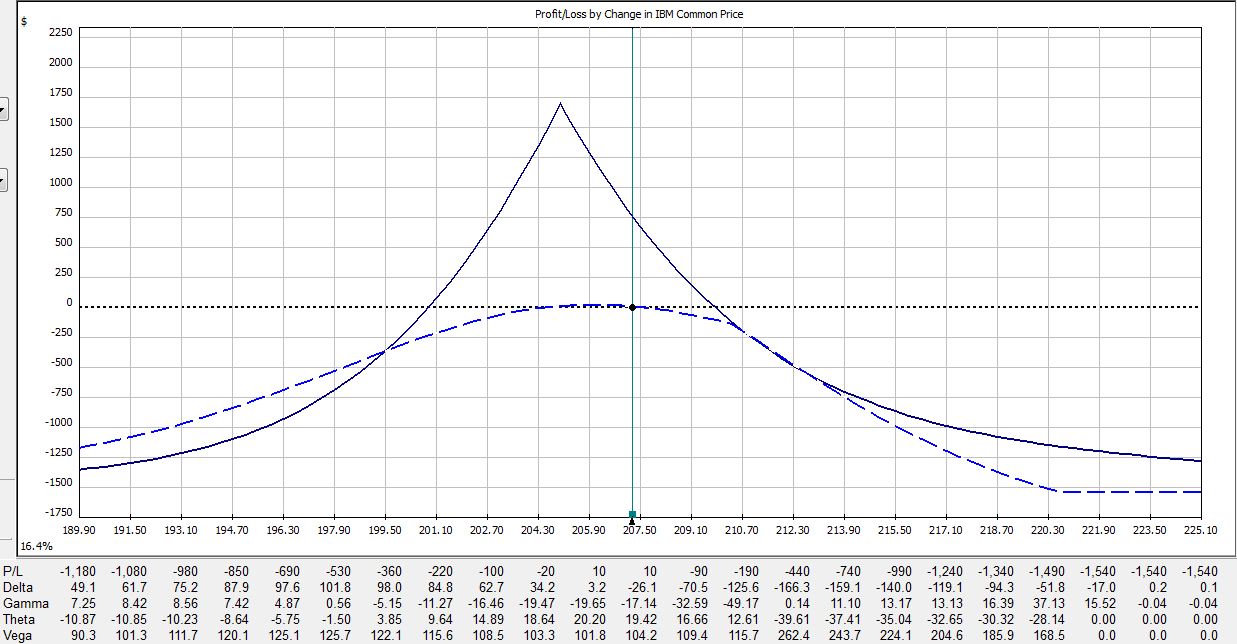
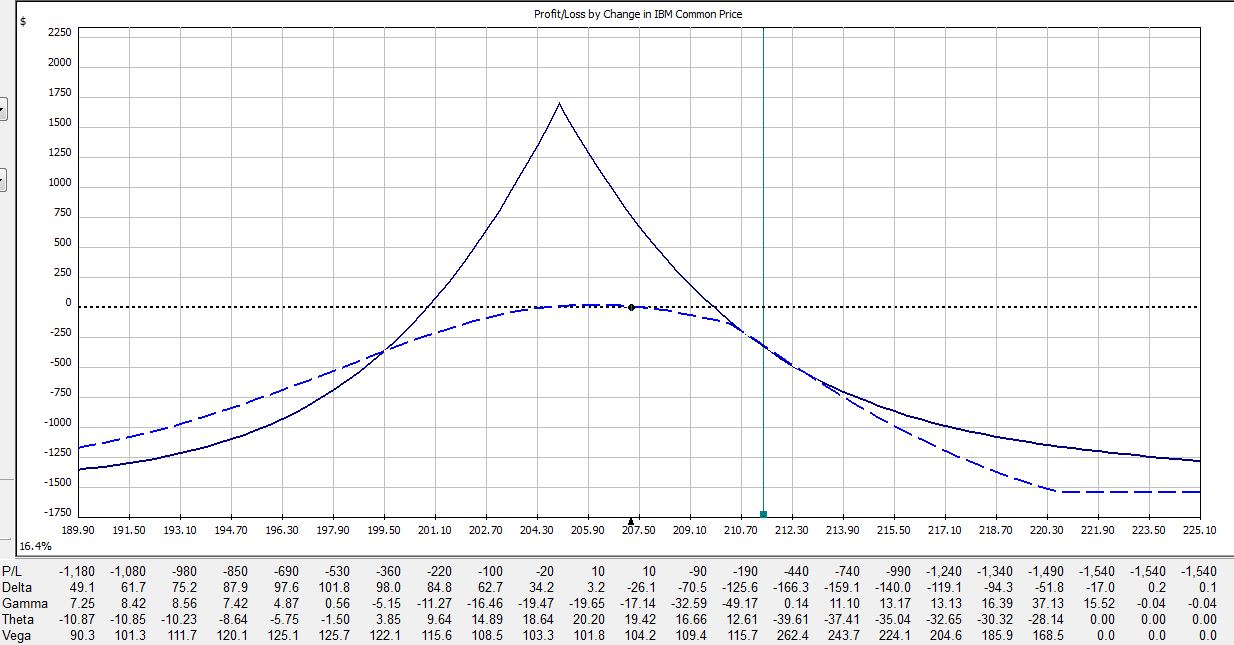
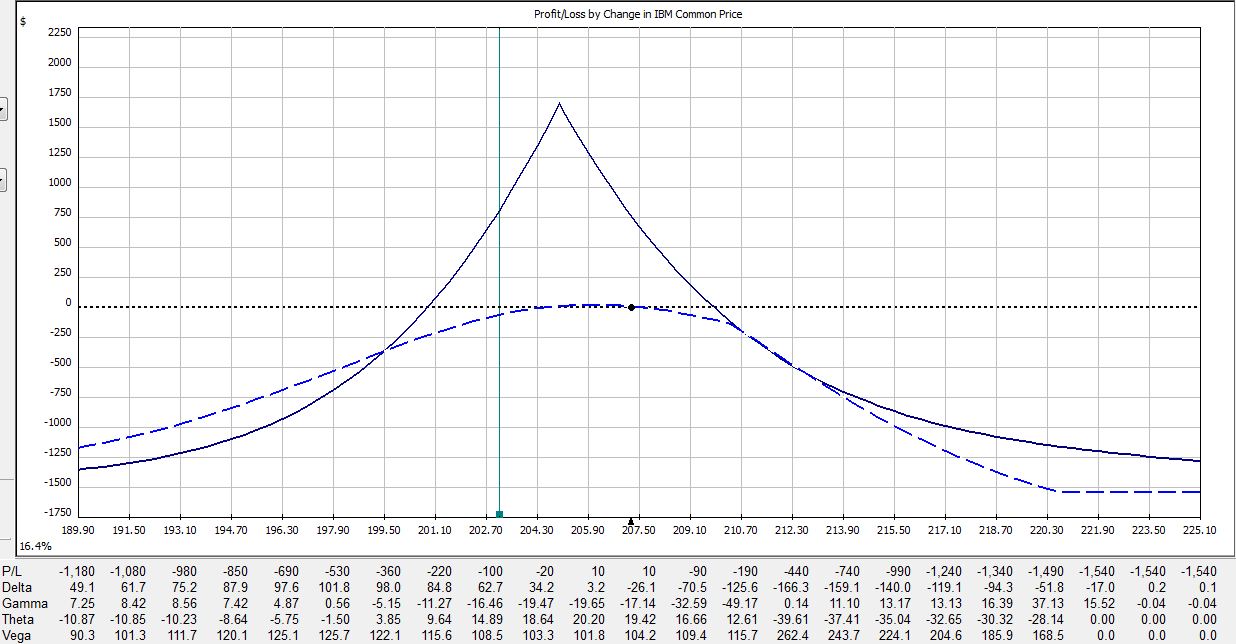
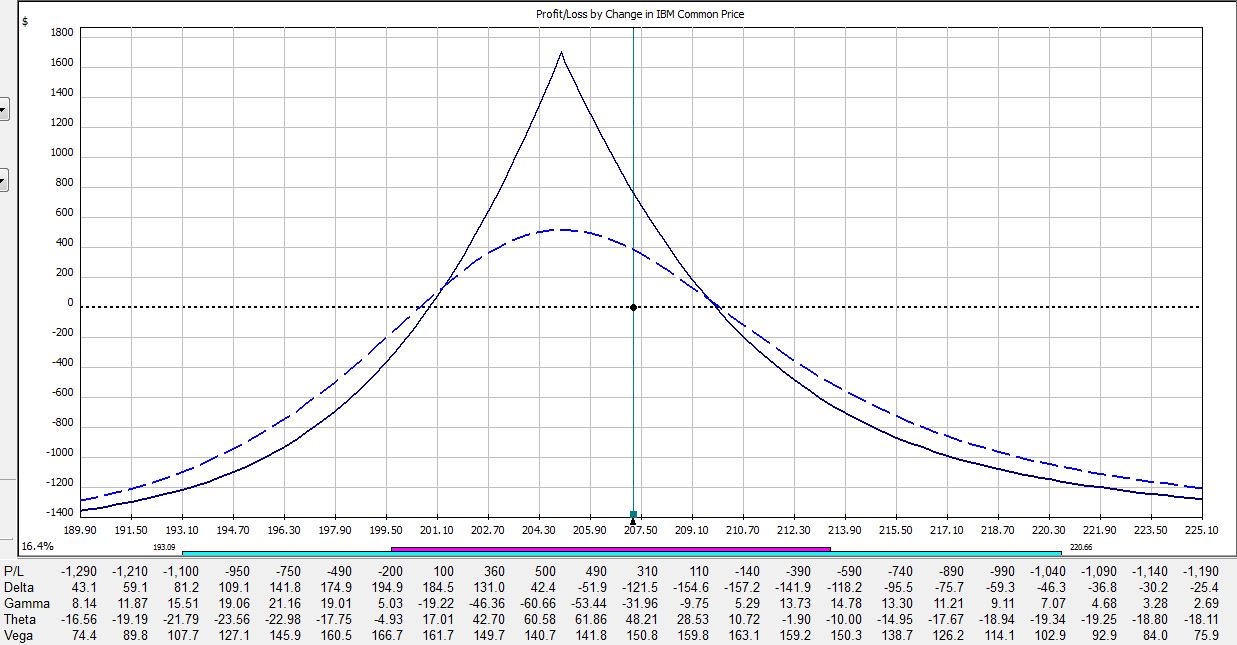
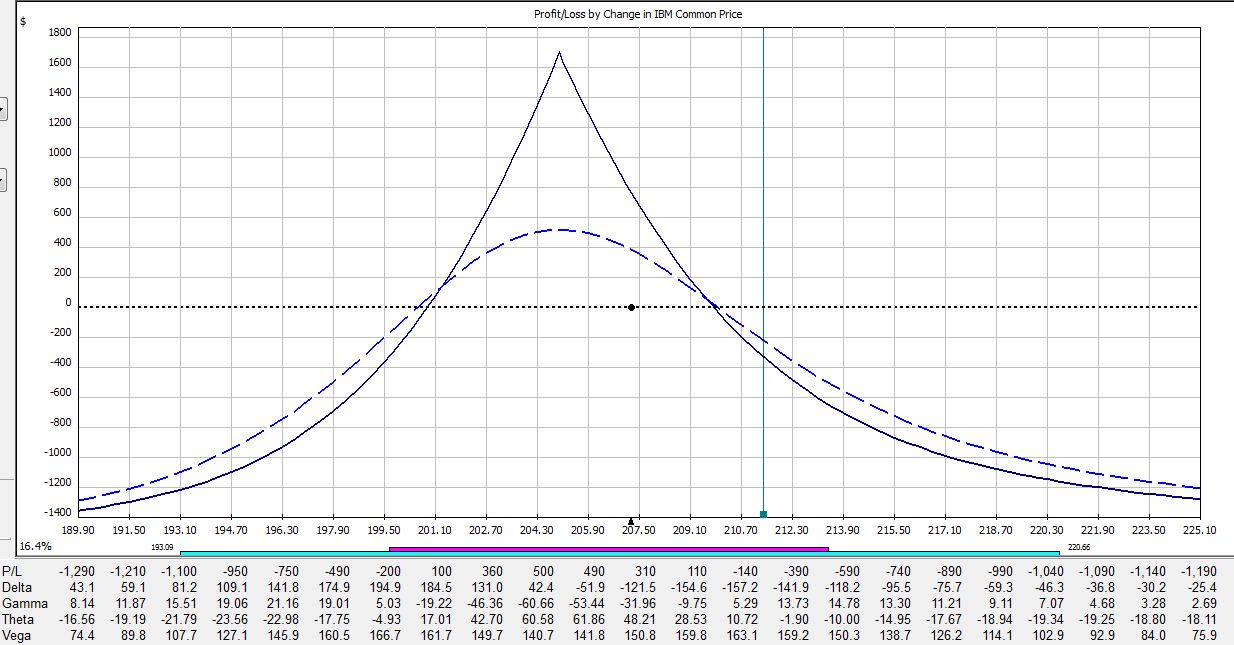
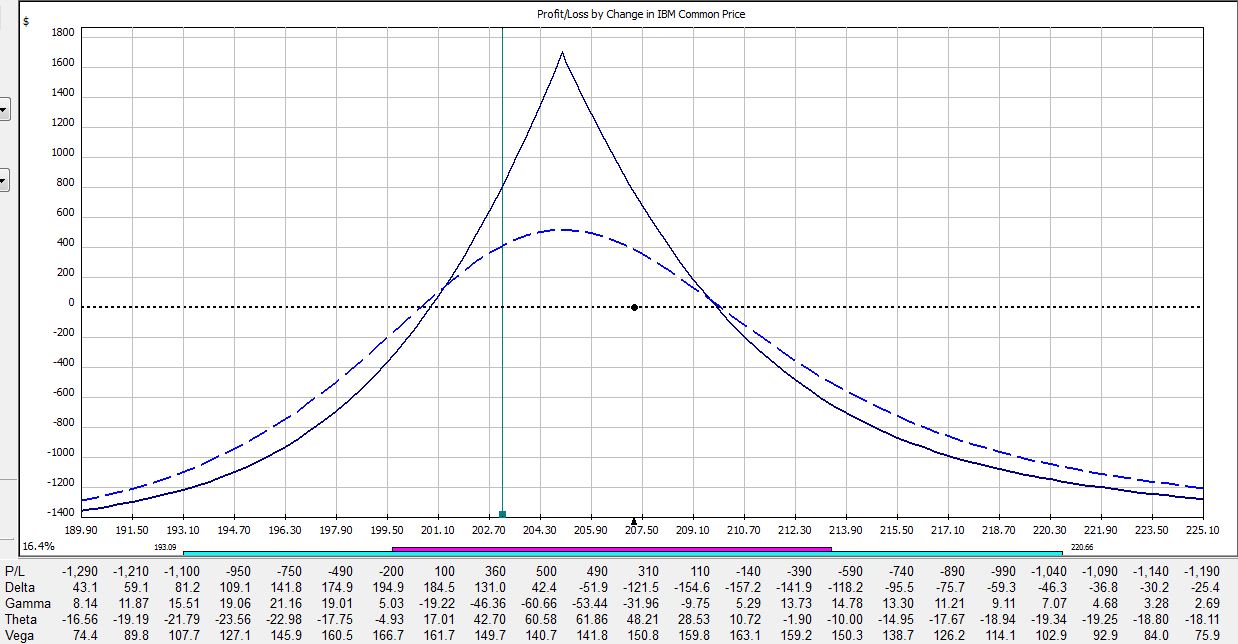
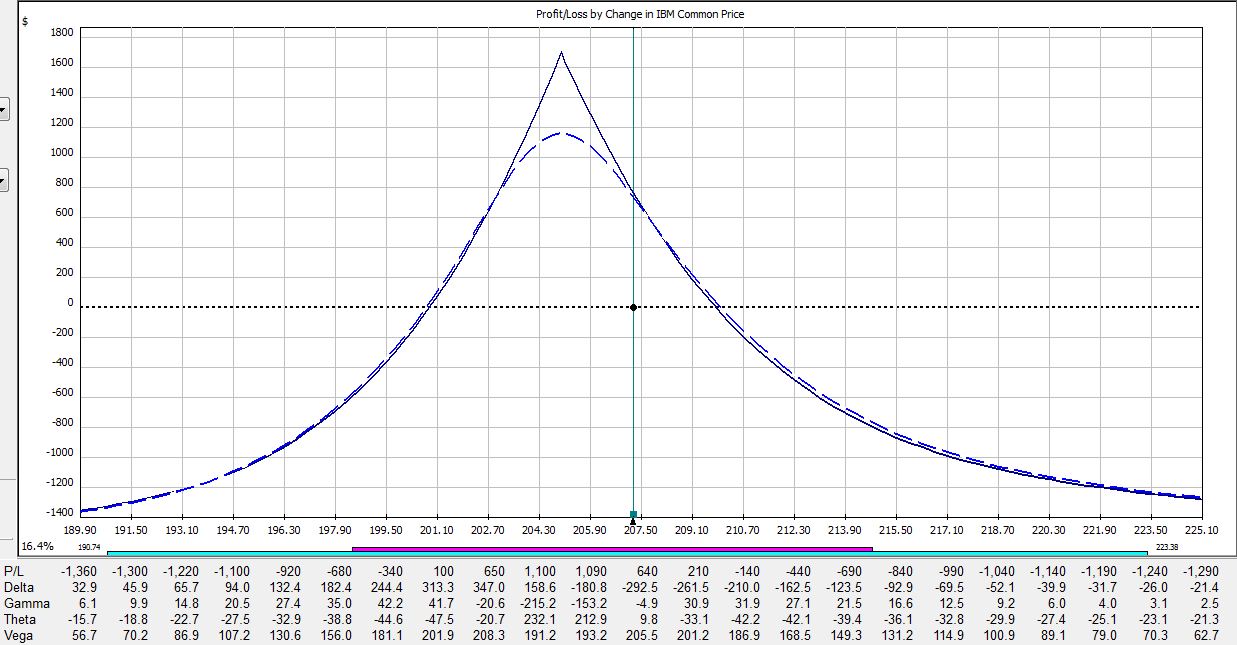
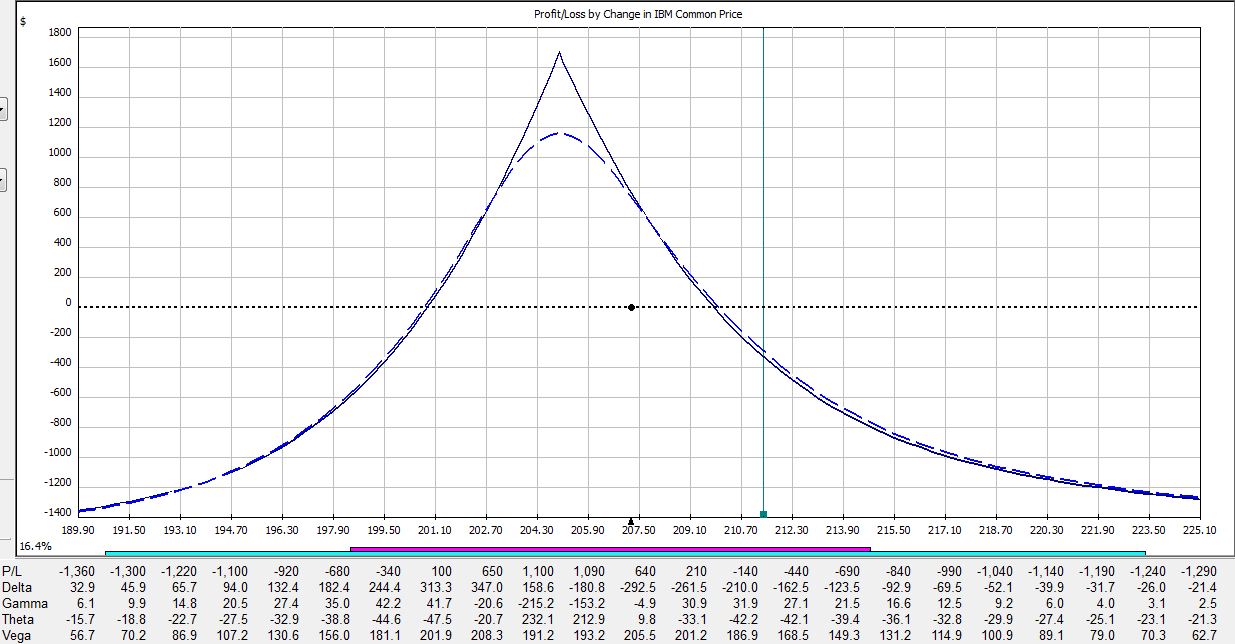
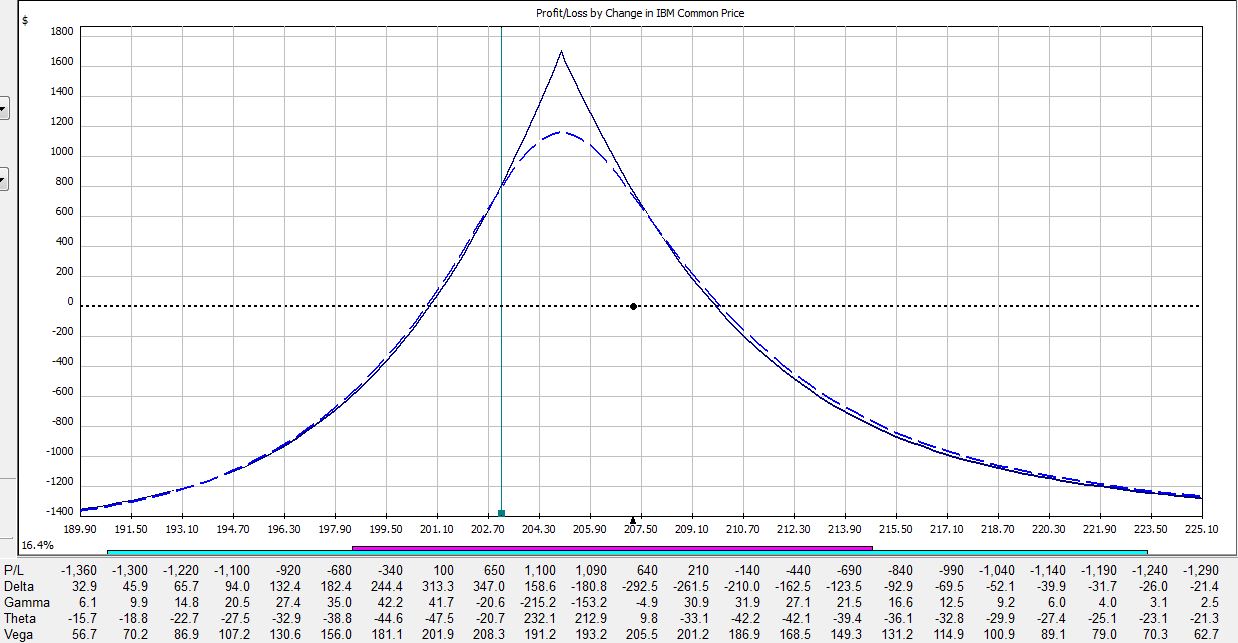
All pictures are risk graphs of a May/Jun 205 IBM call calendar trade (10 contracts) placed today (4/27/12), which is 22 days to May expiration. The P/L is the intersection of the green, vertical line and the blue dotted line.
At trade inception, we have this:
If IBM were to move up 2% today then the trade would be down $309:
If IBM were to move down 2% today then the trade would be down $50:
If IBM were to remain unchanged then in 15 days the trade would be up $353:
If IBM were to move up 2% then in 15 days the trade would be down $225:
If IBM were to move down 2% then in 15 days the trade would be up $400:
If IBM were to remain unchanged then in 21 days on the Friday before option expiration, the trade would be up $720:
If IBM were to move up 2% then in 21 days the trade would be down $275:
If IBM were to move down 2% then in 21 days the trade would be up $790:
Here is a summary of these changes in percentage return on investment:
The table says at trade inception, a 2% move in the stock could result in a 20% loss. In just over two weeks, that 2% move in the stock could result in a 38% loss. On the day before option expiration, that 2% move in the stock could result in a 65% loss!
Psychic pain is seeing routine moves in the underlying suddenly have huge effects on the P/L. At some point, many traders would opt to close the trade so as not to worry about this negative gamma risk. Negative gamma risk can keep you up at night.
Graphically, gamma represents how tightly curved the P/L curve is. As option expiration approaches, gamma becomes huge. While many option trades are capable of “home run” sized returns, it’s truly a shot in the dark because normal moves in the underlying may cost you huge chunks of profit.
Tags: trader education | Categories: Option Trading, Uncategorized | Comments (1) | PermalinkIntroduction to Profit Factor
Posted by Mark on April 24, 2012 at 10:51 | Last modified: April 24, 2012 10:52The profit factor (PF) is one of the most important statistics to calculate when developing a trading system.
PF is defined as total profits divided by total losses. Another way of stating this is:
average net profit on winning trades # winning trades
——————————————————- * ————————– (1.1)
average net loss on losing trades # losing trades
Although very similar, I would point out that PF is not exactly the same as a trading system’s expectancy (E):
Expectancy (E) = (Probability of Win * Average Profit) – (Probability of Loss * Average Loss)
E may be interpreted as the average gain or loss per dollar risked on a trade. PF may be interpreted as the number of dollars made per dollar lost. A successful trading system should have E > 0 and PF > 1.
Maintaining a relative equivalence between average losses and average gains is one way to run a successful income trading business. Consider a trading strategy that sells 20 naked puts per month for $2.00 each to collect $4,000. These puts are so far out of the money that only a very rare event will result in a loss. Eventually, October 2008 happens and this very consistent trade suddenly loses $396,000. Not only did this one month just wipe out profits from your last 99, but the psychological devastation will likely result in a swift career change.
The PF calculation gives us the minimal requirements by which to profit through income trading. If a strategy’s average losses are three times its average gains then the second term of (1.1) must equal at least 3 for PF to exceed 1. That is, three trades must win per every trade lost: a win rate of 75%. Similarly, if the strategy loses twice as much as it usually gains then it must win 67% of the time to break even.
I will build on this concept of PF in my next post with an introduction to Sizing Risk.
Tags: trader education | Categories: System Development | Comments (1) | PermalinkProfit with Implied Volatility (Part VII)
Posted by Mark on April 17, 2012 at 09:44 | Last modified: April 17, 2012 09:47To be consistently profitable trading options, you must understand implied volatility (IV). This is the seventh and final post in my “IV Primer.” I hope the six previous posts on the subject have given you a solid foundation for understanding. Today, I’m going to discuss three other types of volatility for you to understand alongside implied.
Future volatility describes the price movement of an underlying over some time period in the future.
Historical volatility describes the price movement of an underlying in the past. For those of you familiar with statistics, this calculation is best done using a sample variance of continuously compounded returns as described here: http://www.investopedia.com/articles/06/historicalvolatility.asp#axzz1sIuSWBYy.
Forecast volatility is a guess about what the future price volatility of an underlying asset will be.
IV is the market’s forecast of future volatility as reflected by the supply/demand for individual options. An option’s price is determined by whether it is a put or call, the underlying asset price, the strike price, the time to expiration, the dividend, the interest rate, and the IV. Given the option price and six out of seven variables, we can algebraically solve for IV. In addition to the multiple ways this IV Primer has offered to interpret IV, now you know the mathematical “nuts and bolts” of how it is actually calculated.
Tags: trader education | Categories: Option Trading | Comments (0) | PermalinkProfit with Implied Volatility (Part VI)
Posted by Mark on April 14, 2012 at 10:23 | Last modified: April 14, 2012 10:26On the road to consistent trading profits, you must understand implied volatility (IV). In the last installment of this IV primer, I covered some theoretical takeaways to remember and today I will add a couple more.
Option trading is sometimes described as “volatility trading,” and hopefully now you have an idea why. With stocks, the goal is to buy lower than you sell. With options, the goal is to buy low IV and sell higher IV. Straddles and strangles are examples of nondirectional trades that can increase or decrease in value only based on IV. The pre-earnings trade described at http://www.optionfanatic.com/2012/04/10/profit-with-implied-volatility-part-iv/ is designed to take advantage of this. Regardless of how or whether the stock moves, the trade aims to profit by buying IV low and selling it high.
Since IV may be interpreted as the market’s expectation for future price movement in the underlying, one could trade discrepancies between IV and the underlying’s historical price movement. Historical volatility (HV) is the average close-to-close move of the stock over the last X trading days. If IV is much higher (lower) than HV then you may consider the market’s estimate to be too high (low). These options might be ripe to sell (buy). In The Trading Guide to Conquering the Markets (2000), Robert Pisani labels IV/HV ratios at or below 0.70 as underpriced options to buy. Overvalued options that should be sold have ratios at or above 1.40. One could develop this strategy into a trading system.
Unless something else comes to mind, I will look to conclude this IV primer with my next post where I will summarize IV alongside other types of financial volatility.
Tags: trader education | Categories: Option Trading | Comments (0) | PermalinkProfit with Implied Volatility (Part V)
Posted by Mark on April 12, 2012 at 09:47 | Last modified: April 12, 2012 09:47In the quest for consistent profitability, my last post continued the “IV primer” (http://www.optionfanatic.com/2012/04/10/profit-with-implied-volatility-part-iv/). Today, I want to take the concepts from the IV trades I have been describing and develop them into two general, theoretical concepts about option trading.
I have talked about IV as a measure of how expensive an option is. I have described long (short) straddles and strangles as trades that profit if the underlying moves a lot (little). I have described theta as the daily decay of long options.
What is this all telling us?
Concept #1: when you buy options, consistent profitability requires large enough price moves of the underlying to outpace time decay. A large move on the first or second day of the trade will result in greater profit than a large move on the 20th or 21st day. When you sell options, consistent profitability requires time decay to outpace price moves of the underlying. A larger move on the 20th or 21st day of the trade has a greater chance of leaving a trade profitable than on the first or second day.
Concept #2: IV is synthetic time. Focusing on time and assuming all else constant, an option becomes more or less expensive as the time to expiration increases or decreases. Focusing on IV and assuming all else constant, an option becomes more or less expensive as IV increases or decreases. An increase in IV is like moving farther away from expiration. A decrease in IV is like moving closer to expiration.
These are important theoretical concepts describing the gist of option trading. If you can understand these concepts with regard to the trades I have been describing in this IV primer then consider yourself to be well educated!
Tags: trader education | Categories: Option Trading | Comments (1) | PermalinkProfit with Implied Volatility (Part IV)
Posted by Mark on April 10, 2012 at 08:11 | Last modified: April 10, 2012 08:11In my last post (http://www.optionfanatic.com/2012/04/05/profit-with-implied-volatility-part-iii/), I talked about buying or selling ATM straddles or strangles before earnings to take advantage of big price moves. These big moves may also be used as a pre-earnings trade.
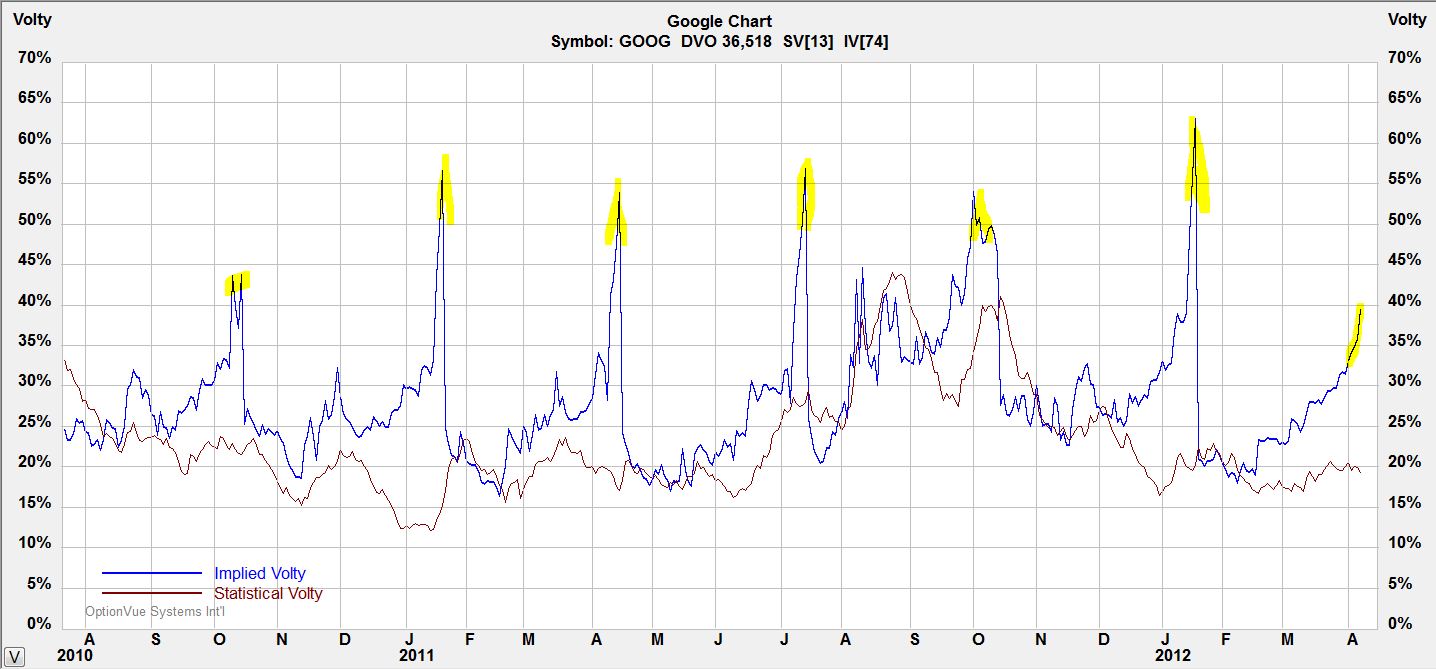
Take a look below at a chart of IV for Google stock (GOOG):
Notice the quarterly IV spikes just before earnings announcements. This is no coincidence since earnings reports are known to cause big moves in stock price.
One way to take advantage of this spike is to buy ATM strangles a few days before earnings and to sell them just before the announcement. Strangles are long volatility; they make money when volatility increases. While options lose money with each passing day (theta decay), money gained from the IV spike will often overcome this decay.
Two guidelines will increase the probability of profiting from this trade. First, look to place this trade on stocks that tend to have big earnings moves. These are the options that will spike largest before the announcement. Second, keep this a very short-term trade. If a company reports earnings after market close on Thursday then you may place the trade on Monday and hold for only a few days. As an example, consider a 4-day trade where options are losing 4% daily due to theta decay. The worst-case scenario would be a loss of 16%. An IV spike of 30-50% or more should offset this.
For January, one GOOG ATM straddle could have been purchased on Tuesday morning for $3,472 with GOOG at $627.72. At 3:30 PM EDT two days later, GOOG was trading at $637.30 and the trade could be closed for a gain of $106 after transaction fees. That’s a gain of 3% in less than three days.
Tags: trader education | Categories: Option Trading | Comments (3) | PermalinkProfit with Implied Volatility (Part III)
Posted by Mark on April 5, 2012 at 10:23 | Last modified: April 5, 2012 10:23In the last installment of this implied volatility (IV) primer (http://www.optionfanatic.com/2012/04/01/profit-with-implied-volatility-part-ii/), I interpreted IV as the market’s prediction of how volatile the underlying market will be on an annual basis. Shortening our time frame from one year to a day or two, IV is commonly used to predict earnings moves of stocks.
To understand this, let me first define straddle and strangle trades. An at-the-money (ATM) straddle is the purchase of the nearest out-of-the-money put and call (different strike prices). An ATM strangle is the purchase of the at-the-money put and call (same strike price). For XYZ at $98.20/share, for example, an ATM straddle trade would require purchase of the XYZ 100 call and XYZ 95 put (assuming 5-point strikes in the option chain). An ATM strangle trade would require purchase of the XYZ 100 call and XYZ 100 put. Long (purchased) straddles and strangles generally profit from big market moves whereas short (sold) straddles and strangles profit by limited market moves.
The expected market move due to an earnings or other event is the average price of the front month (or weekly) ATM straddle and the front month (or weekly) ATM strangle. Consider AAPL stock, which closed on January 24, 2012, at $420.41. Earnings were due after market close. The front month (weekly) was the weekly option, which had four days to expiration. The ATM straddle and strangle were priced at $22.85 and $18.25, respectively. The projected move was therefore the average: $20.55 or 4.9%.
This information may be used in a couple different ways. First, you may look back at historical stock moves after earnings to see where 4.9% fits in the range. If the stock has never moved so little (much) in the last several years of earnings then you may consider the straddle/strangle to be underpriced (overpriced) and elect to buy (sell) it. Second, you may look back at historical stock moves after earnings to see how often the stock moved more or less than the expected move. If it’s about 50/50 then there may be no edge. If the stock almost always moves more (less) than the expected move, however, then you may elect to buy (sell) a straddle or strangle on it.
In my next installment of this series I will describe another trade designed to profit from IV.
Tags: trader education | Categories: Option Trading | Comments (1) | PermalinkProfit with Implied Volatility (Part II)
Posted by Mark on April 1, 2012 at 15:33 | Last modified: April 1, 2012 15:33In the quest for consistent profitability, my post from March 29 (http://www.optionfanatic.com/2012/03/29/profit-with-implied-volatility-part-i/) began a series of writings that I consider to be a primer on implied volatility (IV).
Part I explained a couple things about IV. First, IV reflects how expensive an option is. One may plot IV over days, weeks, or months to get a sense of whether IV is currently in the lower, average, or upper part of the range. Second, IV is driven by supply and demand. The more demand there is to buy an option, the higher its price will become with a consequent increase in IV. The more demand there is to sell an option, the lower its price will become with a consequent decrease in IV.
Statistically speaking, IV may be interpreted as the market’s best guess about how volatile the underlying will be in the future. To understand this, take the IV of an at-the-money (ATM) call (or put) option in the front month with at least 14 days to expiration. That is the projected standard deviation of price movement one year hence. For example, if XYZ at $100/share has an ATM call IV of 30% then the market projects there to be a 68% chance of XYZ trading between $70 and $130/share one year from now.
In my next post, the IV primer will continue with discussion about how implied volatility may be used to predict earnings moves.
Tags: trader education | Categories: Option Trading | Comments (0) | PermalinkProfit with Implied Volatility (Part I)
Posted by Mark on March 29, 2012 at 13:43 | Last modified: March 29, 2012 13:43At the most, “option trading” and “volatility trading” are synonymous terms. At the least, you cannot have a complete understanding of option trading without knowledge of implied volatility. Since I can’t go too far in my discussion of options without covering this topic, I will begin today. What follows in these posts will serve as a primer on implied volatility (IV).
I hesitate to use the S-word here, but a relatively simple interpretation of IV is how expensive an option is. If you go to the grocery store every week and look at apples then you will develop a good sense of price in terms of range and frequency.
Consider a shopper’s hypothetical experience. Suppose the most (least) expensive price he has ever seen for a bag of apples is $3.99 ($1.99) and usually he can buy them for around $2.69. Today’s price happens to be $4.39.
Whether our shopper will buy apples today depends on necessity and/or market outlook. If he absolutely must have the apples now (i.e. stop-loss) then he will pay regardless of price. If apples are not a necessity (i.e. opening a trade) then market outlook will be his deciding factor. If he thinks today’s price is a temporary blip and normal prices will be seen again soon (i.e. trading range) then he will not buy. If he thinks price is just beginning to explode higher (i.e. breakout) then $4.39 is probably a bargain compared to what they will cost in the near future and he probably will make the purchase.
Like stocks, supply and demand is what ultimately drives IV. The more an option is being bought (sold), the higher (lower) its IV will be.
Tags: trader education | Categories: Option Trading | Comments (2) | Permalink