The Tall Tale of Martingale (Part 4)
Posted by Mark on March 24, 2014 at 06:59 | Last modified: February 27, 2014 07:25Given unlimited capital, a Martingale betting system is guaranteed to make money because no matter how extreme the losing streak, at some point I will win. Casinos employ two additional tactics to make sure this does not happen.
I have described at length how large the next bet can become relative to the initial bet during an extreme losing streak.
If this doesn’t sound dire enough already, here’s the kicker in the world of Vegas: even if I have enough money to cover the next double, at some point I will not be allowed to. On a $5 [maximum payout] table, for example, casinos will usually limit the maximum bet to $500-$1000. After eight consecutive rounds of bad luck, I will no longer be able to recoup my losses with the next bet. I might therefore have to win two consecutive games with large bets to end up net positive.
Probability of profit decreases markedly if I must win multiple times in a row to recoup my losses.
The martingale gambler is targeted further by casinos that also raise the minimum bet. Martingaling relies on the number of times I can double while still remaining within table limits because I am always less likely to lose (n + 1) consecutive times than I am to lose n times in a row. I could simply play at a table with a larger maximum bet except typically the minimum bet is proportionally larger as well. This maintains the same number of betting doubles before table limits are reached.
Here’s the bottom line: if I lose enough times in a row with a Martingale betting system then I will go broke and not have enough money to continue or I will reach the table limit. While martingaling can work in the short term, the longer I play the more likely I am to encounter an extreme losing streak forcing a meeting with my demise since I will be prohibited from raising my bet high enough.
In Vegas and on Wall Street, there is no free lunch despite an occasional illusion to the contrary.
Categories: Money Management | Comments (0) | PermalinkThe Tall Tale of Martingale (Part 3)
Posted by Mark on March 21, 2014 at 06:41 | Last modified: February 27, 2014 06:57Here’s a brief review of what I have discussed with regard to Martingale betting systems.
Although rare, extreme losing streaks most definitely occur. Martingale betting therefore favors shorter playing times because the longer I play, the more likely I am to encounter an extreme losing streak.
Martingale betting systems involve doubling my bet every time I lose. A long losing streak could easily have me down over $10,000 from a $5 initial bet.
Most people could never tolerate facing a loss that is orders of magnitude larger than the potential gain. If this has never happened to you then consider it extensively before attempting a trading system that carries a large potential drawdown.
I’ll go one step further…
If this has never happened to you then I strongly suggest assuming you would not be able to tolerate it either! Find another trading system or position size the system very small to prevent a heavy drawdown from significantly denting your total net worth. The alternative is learning something about yourself at the worst possible time: when you exit a trading system only to realize a catastrophic loss of capital.
Unfortunately, this has happened to me.
Would you ever stand being down over ten grand with the hopes of ending up five bucks? Most traders and investors cannot sleep at night or deal with the anguish of losing so much money when they stand to make so little even though they are one win away from vaporizing the entire loss.
Does that make us weak? Yes but no: with every additional loss, the huge loss I face doubles again! Maybe getting out with a few bucks to my name is better than losing absolutely everything.
In my next post I will describe a couple other ways casinos stack the deck against Martingale betting systems.
Categories: Money Management, Option Trading | Comments (1) | PermalinkThe Tall Tale of Martingale (Part 2)
Posted by Mark on March 18, 2014 at 07:07 | Last modified: February 26, 2014 08:48In the last post I mentioned, “while rare, extreme losing streaks do occur.” This is an important detail worthy of extra time.
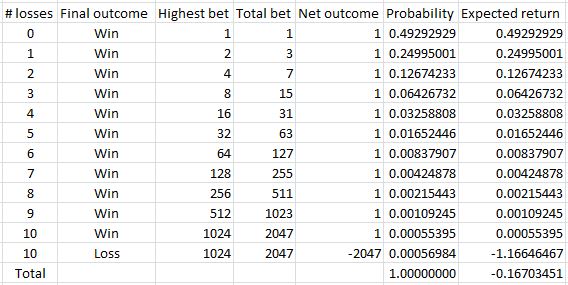
One of the best bets in a casino is found in the game of Craps. The table I presented in the last post assumed even money bets, which are very hard to find in the real world. Casinos make their money on the house edge. Betting the pass line in Craps offers a 49.29% probability of winning, which translates to a low 1.41% house edge.
Consider a simple Martingale betting system with $1 as the standard bet. Suppose I have $2,047, which can cover up to 10 consecutive losses. Here is a table of outcomes:
Looking at the probability column tells us just how rare those extreme losing streaks can be. The chance of five consecutive losses is about 1.6%. The chance of 10 consecutive losses is 0.055% or one out of every 1818 times. The chance of being struck by lightning (based on number of people hit each year) is one out of three million. The odds of winning a million dollar lottery are roughly one in 10-12 million. Compared to these numbers, then, the odds of 10 consecutive losses are pretty good!
How scary is that?
That there is any chance of an extreme losing streak means the Martingale betting system favors shorter play over longer play. The longer I play, the more likely I am to encounter such a losing streak. If I knew how many rolls per hour occurred in a particular Craps game then I could calculate the odds of experiencing one based on playing time.
Regardless of duration, the ultimate arbiter of whether I will “live to play another day” lies in the hands of Chance.
I will write more on Martingale betting systems in the next post.
Categories: Money Management | Comments (1) | PermalinkThe Tall Tale of Martingale (Part 1)
Posted by Mark on March 13, 2014 at 06:07 | Last modified: February 21, 2014 05:34Dollar cost averaging (DCA) appears to be a panacea based on Rich MacDuff’s position archives. To best explore the risk and downside of DCA, I’m going to borrow from the world of gambling and explore the Martingale betting system.
Martingale betting systems date back to 18th century France.
The typical Martingale betting system works as follows. Start by making a standard bet on a [roughly] even-money gamble like red in roulette or Tails on a coin flip. If you win then repeat the standard bet. If you lose then double your previous bet. After a series of losers, when next you win your net profit on the series of games since the last win will be the standard bet.
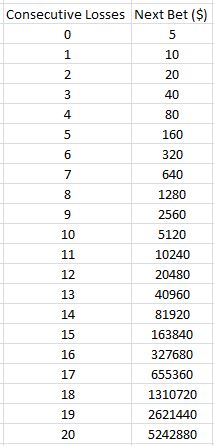
Let’s go through a Martingale example. Suppose I bet $5 and win. I bet $5 again but this time I lose. Next I bet $10 and I lose. Then I bet $20 and I lose. Sticking to my system, I then bet $40 and I win. Two winners (in five attempts) and I am up $10. As long as I can double my bet after losing, I am guaranteed to come out ahead when I win.
Unfortunately, in real life I cannot always continue to double. One reason is because at some point I will likely run out of money. While rare, extreme losing streaks do occur. If I lose 11 consecutive games as described above then…
…I will have to risk $10,240 for the next bet. If I cannot afford that, then I will realize a $10,235 (minus the number of wins multiplied by $5) loss.
Do most people even have ten grand when they walk into a casino? I would probably need a briefcase or a big duffel bag to carry that around and that would make me nervous! I’d probably want a security detail to avoid being robbed.
I will continue this discussion in the next post.
Categories: Money Management | Comments (1) | PermalinkCovered Calls and Cash Secured Puts (Part 36)
Posted by Mark on March 10, 2014 at 03:08 | Last modified: February 21, 2014 04:56Today I want to get back to discussion of dollar cost averaging (DCA) as a position management technique and its implications for risk management.
In his book Systematic Covered Writing, Rich MacDuff writes:
> …the disadvantage of using the [DCA] strategy
> stems from the possibility of further price
> erosion of the stock after a second purchase.
> This sets up the possibility of [DCA]…
> a second time.
Just how much more capital should I be willing to commit to a position as it goes against me?
Without defining this number, I cannot know how much cash to keep on the sidelines in case I need to use it. If this is unknown and I am willing to repeat the DCA process then I am playing a game of unlimited risk. I may go months to years without ever realizing this or thinking this way because such a string of bad luck may come around once in a blue moon. Nevertheless, when that “blue moon” or “black swan” does show itself, I am a prime target for getting blown out of the water… maybe never to trade again.
Keeping money on the sidelines also complicates the matter of calculating returns. Recall the last post where I derived the possibility of having to make 3,432 trades in one year. That involved trading the whole account. The total return of the account drops proportionally to the percentage of cash I keep on the sidelines, though. The 15% annualized return MacDuff frequently writes about becomes 9-12% annualized if 20-40% of the account, respectively, sits on the sidelines in cash for use toward DCA when [or if] needed.
In my next post I will borrow from the world of gambling to further study the pros and cons of DCA.
Categories: Money Management | Comments (1) | PermalinkCovered Calls and Cash Secured Puts (Part 9)
Posted by Mark on November 11, 2013 at 06:14 | Last modified: January 14, 2014 07:35Earlier in this blog series I posted a risk graph showing why CCs and CSPs are less risky than stock. In the last post, I reviewed backtesting results showing index CC returns ($BXM) to be roughly equivalent to the index itself with only 67% of the volatility. This affirms my former illustration and can mean better returns for traders.
I will use downside volatility to explain why this is the case. Volatility of returns is always something to monitor when understanding performance of a trading system. Volatility is measured by standard deviation to determine how much returns deviate from their average. Returns may deviate to the upside or downside but downside volatility is what makes me uncomfortable as a trader. The more I lose, the more stress and discomfort I will experience. If this becomes extreme then I will stop trading the system even if it means exiting at the worst time. At least I can then begin to accept the magnitude of loss and not have to worry about future losses becoming even larger.
Lower standard deviation of returns means the system may be traded in larger size. Suppose my loss tolerance is 20% of the total account. For the sake of simplicity, I will say the S&P 500 lost 50% in the 2008-2009 financial crisis. I therefore would not have wanted to invest more than 40% of my account in the S&P because the resultant loss would be 20% total. Because the $BXM exhibits roughly 67% of the S&P volatility, the $BXM may have only lost 33.5% during the financial crisis. I could therefore have invested 60% of my account in $BXM while remaining within tolerance limits.
Being able to invest more of my account equates to larger returns. An 11.7% per year return equates to 4.68% on the whole account when investing 40% and 7.00% on the whole account when investing 60%. These differences compound over time. Over 25 years, $1 million becomes $3.138M in the S&P 500’s case vs. $5.427M in the $BXM’s case.
Categories: Money Management, Option Trading | Comments (2) | PermalinkTrading System #3–Naked Puts (Part 3)
Posted by Mark on December 10, 2012 at 03:29 | Last modified: November 24, 2012 09:42In http://www.optionfanatic.com/2012/12/07/trading-system-3-naked-puts-part-2/, I explained why trading the NP system with $200K of initial equity is not feasible because the system could go bust upon max DD. To lower the max DD %, I need to increase initial equity.
How much initial equity is required depends on how much DD I am willing to tolerate. A market crash max DD of 50% would require at least $470K initial equity for the NP system. Most professionals (e.g. hedge fund managers) supposedly aim for a max DD of around 20%, which would require an initial equity of $1.17M. Since “my worst DD is always ahead of me,” I should be even more conservative and multiply this by 1.5. Now my starting account value should be $1.76M to avoid any DD over 20%. Suddenly, that profit of $1.19M (http://www.optionfanatic.com/2012/12/06/trading-system-3-naked-puts-part-1/) is only 67.8% over 12 years rather than 604%. This amounts to a mediocre annual return of 4.40%.
For me personally, the most shocking aspect of this analysis is the high profit factor (PF). I have always liked PF as a trading system metric because it describes number of dollars gained per dollar lost. With the NP system, winning trades outpaced losers by a count of 113 to 16 and the average winner made $18,296 vs. -$54,784 for the average loser. This amounts to a PF over 2.35, which should be like an ATM machine shooting out $100 bills! Reality, though, is a lackluster average annual return of 4.40%.
Bottom line: risk cannot be understood without regard to DD. DDs will generate that pit in my stomach. DDs will induce the psychic pain that will keep me up every night. DDs will change my perception to imagine nothing more refreshing than exiting the market completely to free me of all the stress and worry. The cost of selling out, of course, will be to move that max DD from the unrealized column to the realized one.
I will continue this analysis in my next post.
Categories: Money Management, System Development | Comments (1) | PermalinkSizing Risk (Part III)
Posted by Mark on May 2, 2012 at 23:34 | Last modified: October 1, 2012 05:52Sizing Risk is a common trading plan element that can pose a challenge to consistent profitability.
As discussed in Part I (http://www.optionfanatic.com/2012/04/26/sizing-risk-part-i/), these are scaling trading plans with a profit target of 15% and max loss of 20%. Suppose $10,000 is allocated per tranche for up to three tranches. The trade will then profit $1,500, $3,000, or $4,500–fifteen percent–depending on how many tranches are placed. When the trade loses, it will usually be after completely scaling in: 20% of $30,000 is $6,000 lost.
This monthly trade will therefore have to profit at least 75% of the time to be profitable. If the trade wins eight months out of 12 and averages two tranches for each winning month then in one year it will make 8 months * $3,000/month = $24,000 and lose 4 months * $6,000/month = $24,000. If the trade only wins seven months and loses five months then the annual return will be -30%. Should it have a tough year and lose exactly as often as it wins, the annual return will be -60%, which is nothing less than a good recipe for grounding an account into hamburger meat.
As discussed in my posts on the naked put selling strategy (http://www.optionfanatic.com/2012/03/25/the-naked-put-part-iii/), a common worry amongst traders is to have one catastrophic loss that wipes out many profitable months. Sizing Risk teaches us that making too little in the winning months can be just as harmful to overall returns as catastrophic losses but is much more frequently overlooked.
Tags: income trading | Categories: Money Management, Option Trading | Comments (0) | PermalinkSizing Risk (Part II)
Posted by Mark on April 30, 2012 at 13:31 | Last modified: April 30, 2012 15:02In Part I on Sizing Risk (http://www.optionfanatic.com/2012/04/26/sizing-risk-part-i/), I described a scaling strategy that aims for a 15% profit target and 20% max loss. Because allocated capital may remain on the sidelines, the strategy actually aims for a 10% average profit target with 20% max loss. This lowered profit target raises a challenge to profit factor because it loses even more in bad months than it profits in good months.
If the trade reaches 15% profit on 33% or 67% of allocated capital then why not hold the trade until it reaches 45% or 22.5% profit respectively, which would be the same net profit as 15% on 100% of allocated capital?
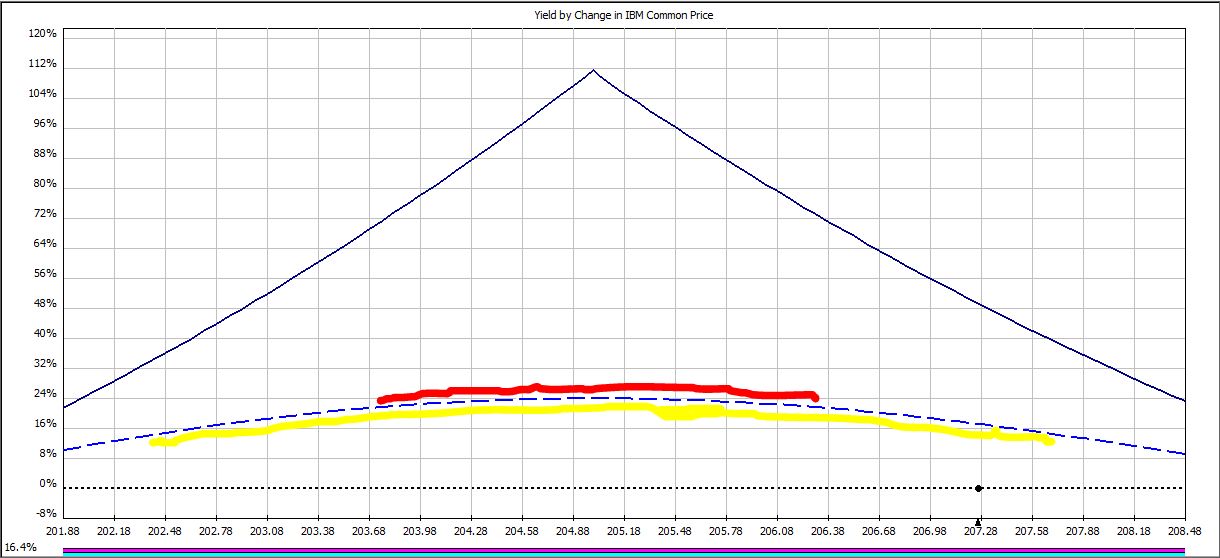
On certain days, a profit target may be hit when IBM trades within a price range. For example, to hit the 22.5% profit target on trade day 12:
IBM must trade within a range only 22% as wide (red line) as it must trade to hit the 15% profit target (yellow line).
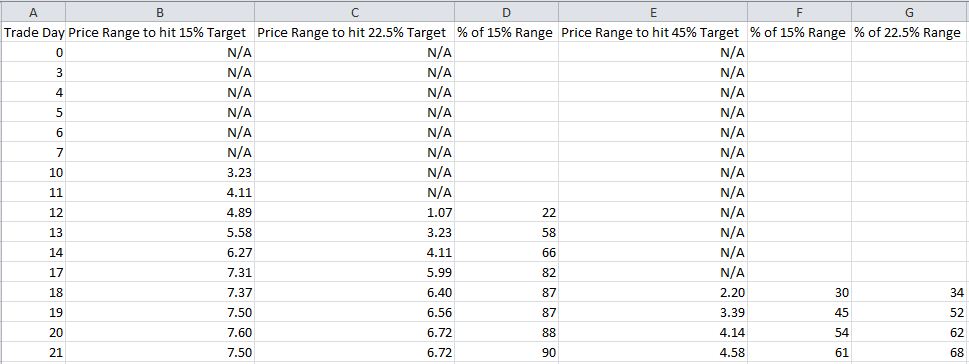
In the table below, Columns B, C, and E describe the range of price ($) in which IBM must trade to hit the three profit targets:
Out of 16 total, the 15%, 22.5%, and 45% profit targets may only be hit on 10, 8, and 4 trading days, respectively. As profit target increases, fewer days are available to hit the target.
Next, study Columns D, F, and G, which compare the magnitude of price ranges over which profit targets will be hit. I made a Day 12 comparison with the red and yellow lines, above. Columns F and G indicate that on two out of the four days when the 45% profit target may possibly be hit (Days 18 and 19), the price range is 52% as wide or less than that required to hit the lower profit targets.
Not only do higher profit targets allow for fewer days when price targets may be hit, they also mean for a lower chance of hitting targets on those days.
My last post on negative gamma risk (http://www.optionfanatic.com/2012/04/27/undressing-negative-gamma-risk/) explains this. As option expiration approaches, routine changes in stock price can cost us more and more money–potentially even turning a nicely profitable trade into a loser at the last moment.
This is the argument against holding a modestly profitable trade longer in an attempt to hit the higher profit targets.
Tags: income trading | Categories: Money Management, Option Trading | Comments (0) | Permalink


