Naked Puts (Part 4)
Posted by Mark on November 25, 2015 at 06:27 | Last modified: November 5, 2015 06:58In order to better understand the naked put trade, I have designed an apples-to-apples comparison between the naked put and long shares trade.
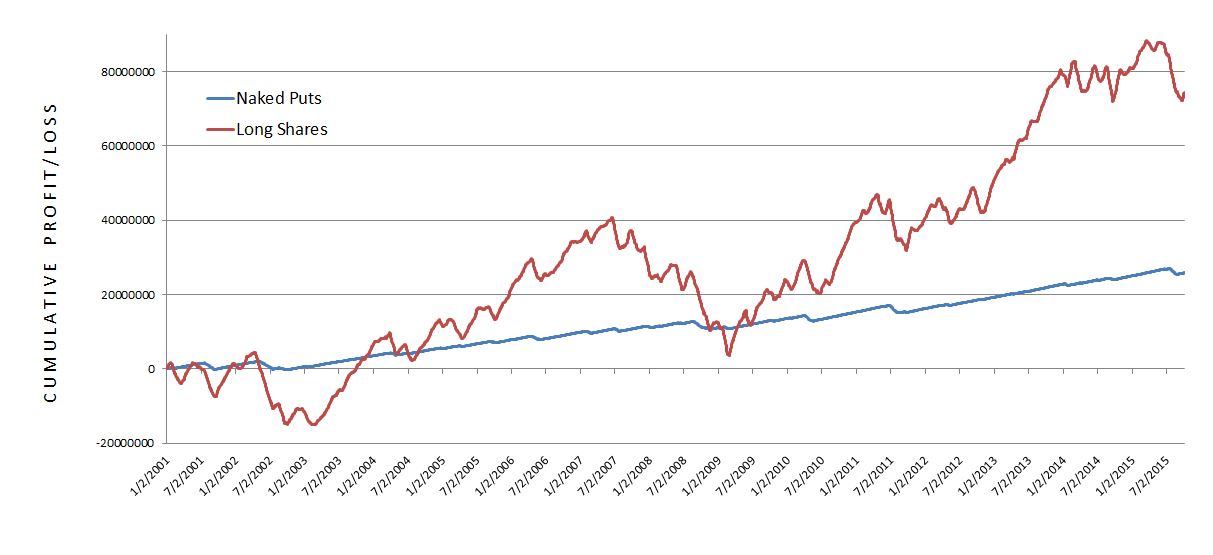
Here are the results:
Three main observations jump out at me and I will discuss these in order:
- The shares trade is more profitable
- Drawdown in shares trade is much worse
- Naked puts are much more consistent
First, the shares trade is more profitable. No doubt about that! The shares gained $74.5M compared to $25.8M for the naked puts over 14+ years. Before I get starry eyed in thinking how I will do the shares trade and make sooooo much money, though, I need to better understand how much I can lose and how much I need to start the trade.
The latter detail is also addressed by 2 above: the drawdown (DD) in the long shares is much worse than the naked put trade. DD is the peak-to-trough decline during a specific period of an investment or trade. DD represents a minimum starting equity amount to do a trade. If the worst (maximum) DD ever seen over the period of a backtest is -$200,000 then I better have at least $200,000 in the account to do a trade. If I don’t then I’m at increased risk of going bust. Traders often say “your worst DD is always ahead of you” to suggest no matter what size DD you found in backtesting, a larger DD can be expected to occur in the future. To be safe, then, my starting equity should be greater than max DD.
DD is also important with regard to risk tolerance. I will pick up here next time.

Comments (3)
[…] I left off with a graphical performance comparison between the long shares and naked put trades. […]
[…] The greater consistency can be seen in terms of the straight blue line that moves in a narrow range relative to the jagged r…. […]
[…] I prepared the initial graph comparing naked puts with long shares, I became aware how much capital risk this arbitrary position size was […]