The “Fitz” of Retrospect (Part 1)
Posted by Mark on June 3, 2013 at 04:01 | Last modified: July 25, 2013 11:50Dan Fitzpatrick (a.k.a. “Fitz”) is a talking head who has been featured on CNBC’s “The Call,” Jim Cramer’s “Mad Money,” and theStreet.com where he posts “3 Stocks I Saw on TV.” Not surprisingly, he also has his own premium trading service called Stock Market Mentor. In his free chart of the day from October 16, 2010, he did something that I have seen virtually every “educated” stock market commentator do: try and get us to fall for the illusion of Retrospect.
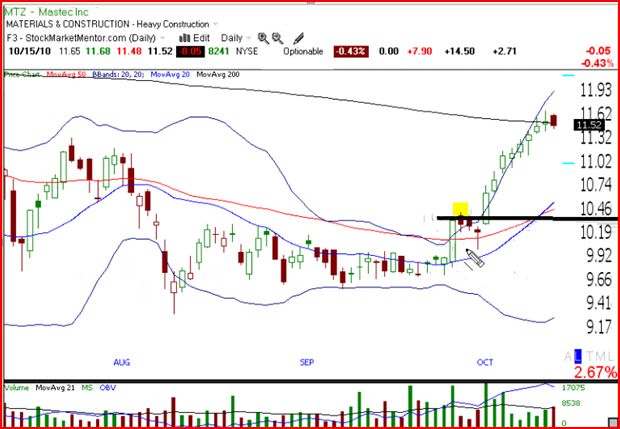
In this video, Fitz discussed a breakout trade on Mastec Inc. (MTZ). The chart is shown below:
On the chart, you can see the black line Fitz drew to coincide with the top of the large green candle in September. This is the breakout level. Fitz then explains:
> “When the stock gets above the initial breakout level is when you want to
> participate… this is a textbook volatility squeeze. I see this so much where
> you get the initial move one day—BAM—that draws your attention to the
> stock, only the next day—yeah it went up a little bit but it was kind of
> weak. It came back down and then finally you get this blowout above the
> initial breakout level… now you’re in at, say, $10.50 and you ride it clear
> up to $11.50 and you’ve made 10%.”
How easy does that sound as a way to print money?
The premise of this trade is to enter long when MTZ trades above the black line. MTZ did just that the very next day (yellow highlighting). Fitz notes this even though “it was kind of weak.” He glosses over it as if you would not take this trade. His chart pretty much hides it, and unless you were watching with a critical eye, you might not really see it, either. The dramatic breakout, after all, is a few days later.
I will conclude with my next post.

Comments (1)
[…] my last post, I discussed an MTZ trade that Dan Fitzpatrick explained could have easily made you 10% in a short […]