The Naked Put (Part II)
Posted by Mark on March 22, 2012 at 10:53 | Last modified: March 29, 2012 13:56The holy grail of trading could be achieved through booking consistent profit on a daily basis. In my last post on March 20 (http://www.optionfanatic.com/2012/03/20/the-naked-put-part-i/), I described an April 510 naked put trade on AAPL. Today, I want to illustrate that trade by presenting a series of risk graphs.
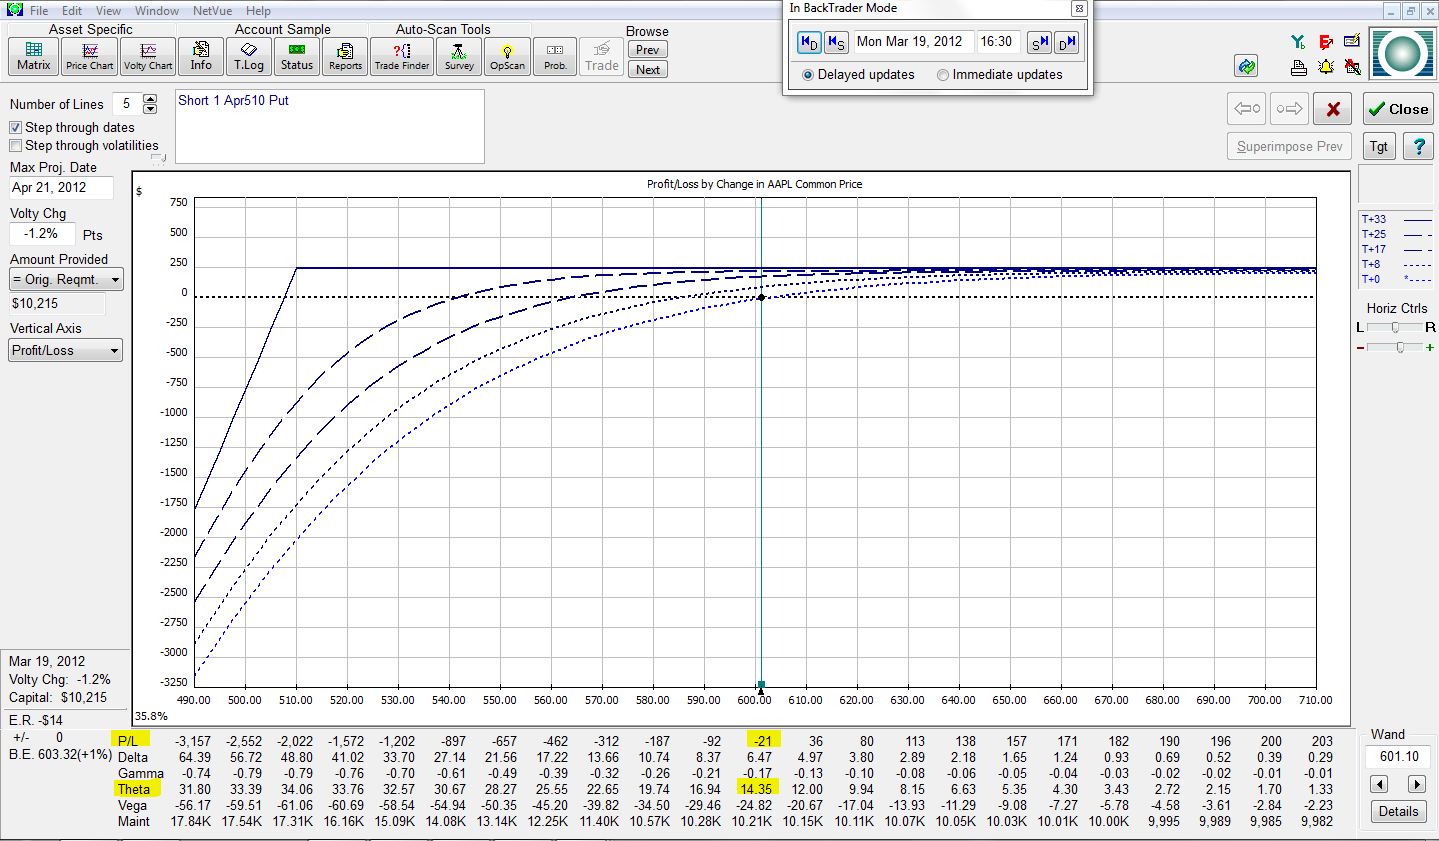
As mentioned, the trade was placed on March 19, with 33 days to April options expiration. At trade inception, the trade looks like this:
The green vertical line is the “wand,” which now sits at AAPL’s current price of 601.10. For the purposes of this analysis, I will assume stock price and volatility (to be described at a later date) always remain constant. The risk graph shows the P/L of the position (y-axis) based on the price of AAPL stock (x-axis). At trade inception, focus on the T+0 curve, which is the lowest dotted curve (also differentiated by a lighter blue color). The yellow highlighting indicates the trade to be currently losing $21 due to transaction costs and to have a theta value of 14.35. The trade will make $14.35/day.
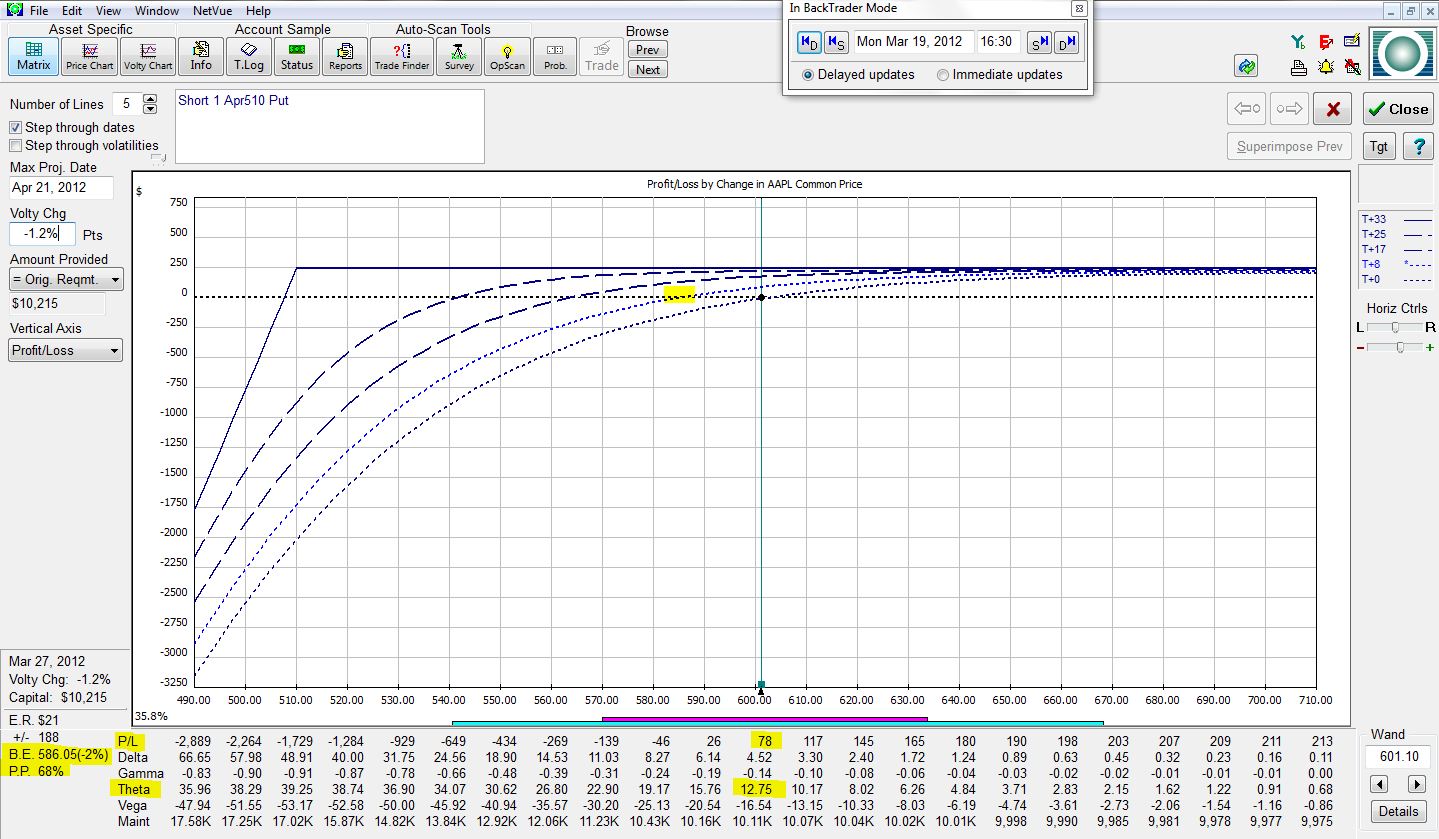
Let’s now fast forward to the next-higher dotted curve, which represents the position eight days into the future:
The P/L is +$78 with a theta value of 12.75. The trade will now make $12.75 per day. The yellow highlighted portion on the dotted curve corresponds with the “B.E.” in the lower left of the risk graph. This shows how far the stock would have to fall (2%) for the trade to be at breakeven (P/L = $0). P.P. is “probability of profit.” Eight days into the future, the risk graph shows this trade to have a 68% chance of being profitable.
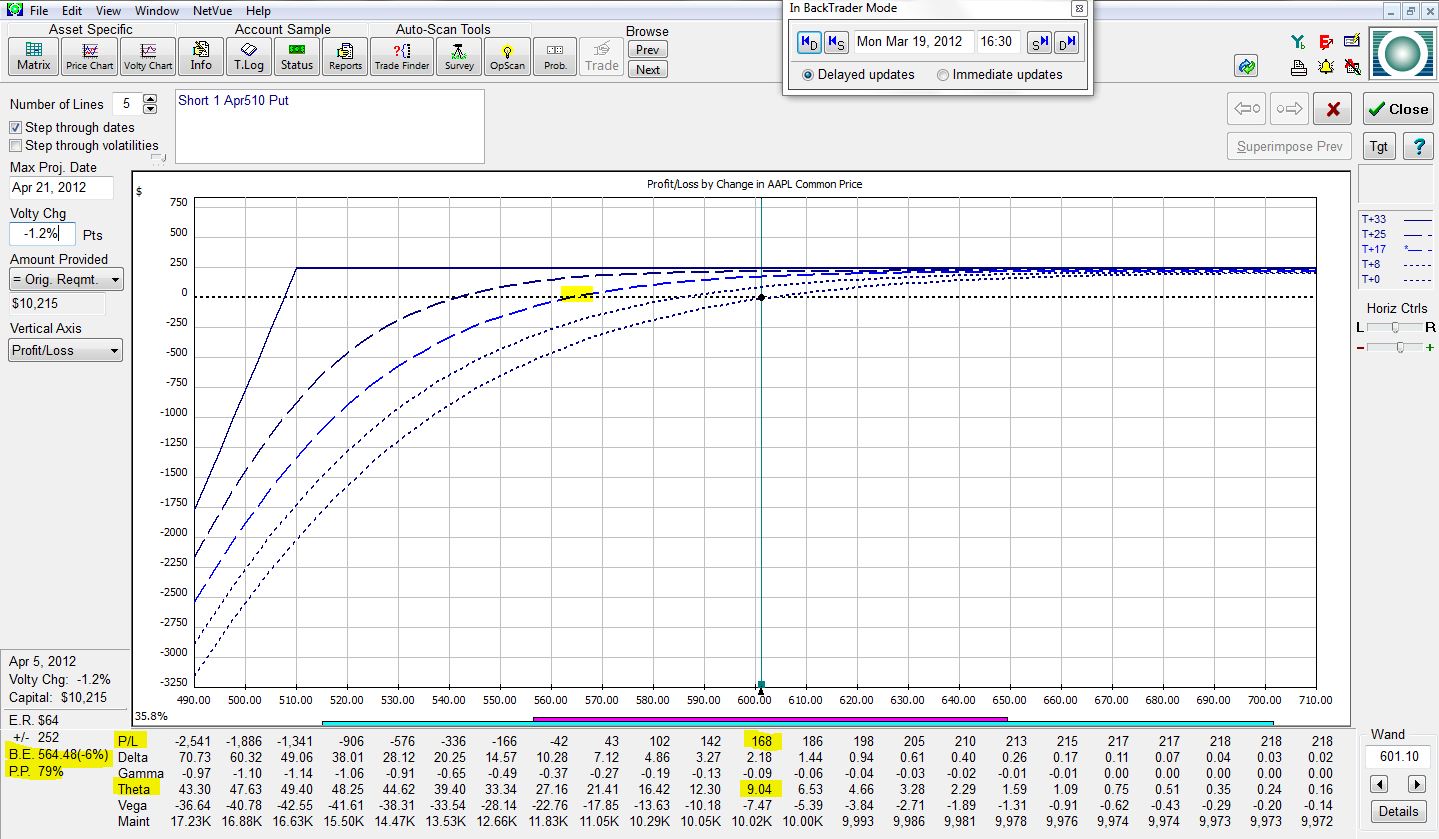
Next, let’s jump nine more days into the future:
The P/L is now +$168 with a theta value of 9.04. The B.E. is 6% below the current market price, which means AAPL stock could drop up to 6% before the profit on this trade evaporates. The trade would have a 79% chance of showing a profit.
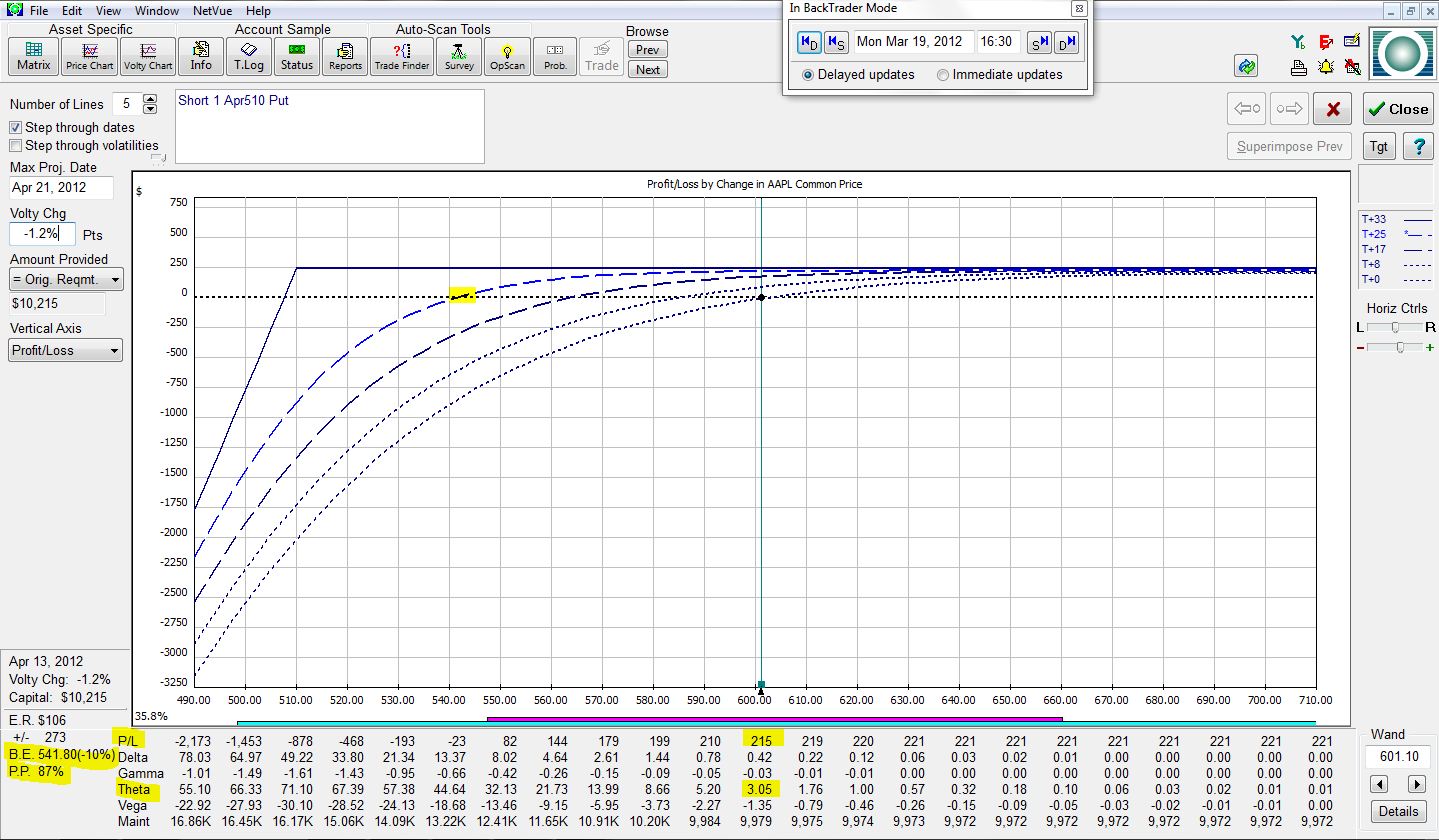
Moving eight days further ahead:
The trade is now up $215 with a theta value of 3.05. AAPL stock could fall up to 10% without this trade showing a loss. The probability of this trade being profitable after 25 days is 87%.
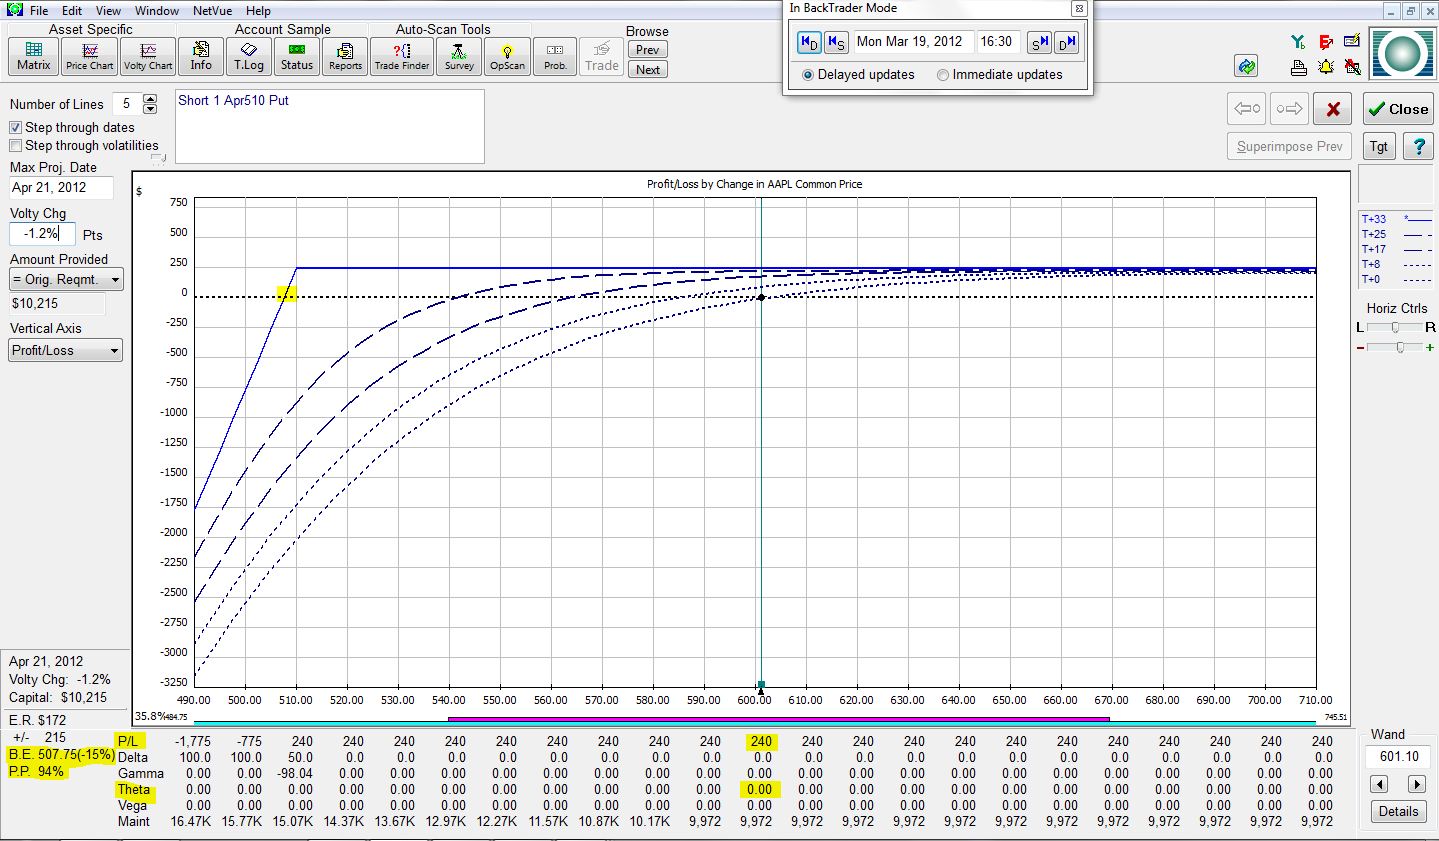
Finally, the risk graph at expiration (eight more days into the future or 33 total days from trade inception) is:
The trade has made the full $240. Theta is now zero since the option has expired. The trade has 15% of downside stock protection and a 94% chance of posting a profit.
Note how theta decreases over time as more and more of the available profit has been made on the trade. In my next post, I will discuss some implications of this observation and go into more detail about the trade.
Comments (2)
[…] positive theta position. The exemplar I have been studying is an April 510 naked put on AAPL (see http://www.optionfanatic.com/2012/03/22/day-by-day-income-trade-analysis/). The profit potential for this trade is […]
[…] positive theta position. The exemplar I have been studying is an April 510 naked put on AAPL (see http://www.optionfanatic.com/2012/03/22/the-naked-put-part-ii/). The profit potential for this trade is […]