Debugging Matplotlib (Part 3)
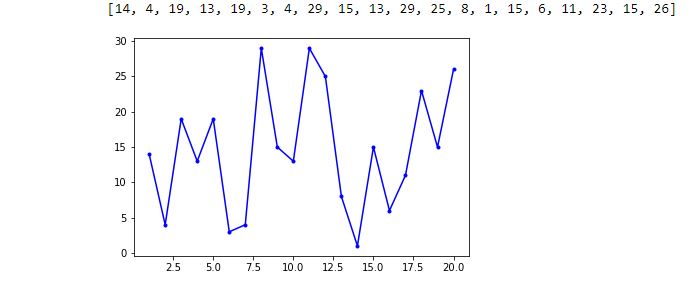
Posted by Mark on May 10, 2022 at 07:07 | Last modified: March 16, 2022 14:44Today I resume trying to fix the x-values and x-axis labels from the bottom graph shown here.
As suggested, I need to create a list of x-values. Even better than a loop with .append() is this direct route:
> randomlist_x = list(range(1, len(randomlist + 1))
This creates a range object beginning with 1 and ending with the length of randomlist + 1 to correct for zero-indexing. The list constructor converts that to a list. Now, I can redo the graph:
> fig, ax = plt.subplots(1)
>
> ax.plot(randomlist_x, randomlist, marker=’.’, color=’b’) #plot, not plt
> plt.show()
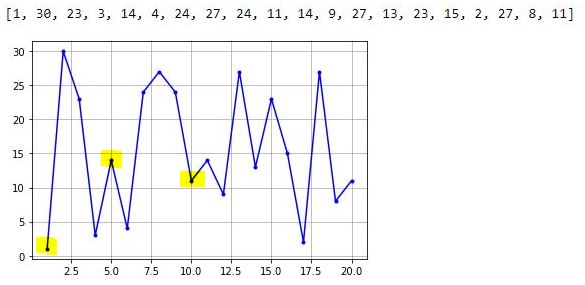
The one thing I can see is decimals in the x-axis labels, which is not acceptable. Beyond that, I don’t have much clarity on the graph so I will add the following to show grid lines:
> plt.grid()
I can now clearly see the middle highlighted dot has an x-value of 5. Counting up to x = 10 for the right highlighted dot, I have confirmation that each dot has an x-increment of 1. The highlighted dot on the left is therefore at x = 1. I have therefore accomplished my first goal from the third-to-last paragraph of Part 2.
To get rid of the decimal x-axis labels, I need to set the major tick increment. This may be done by importing this object and module and following later with the lines:
> from matplotlib.ticker import MultipleLocator
> .
> .
> .
> ax.xaxis.set_major_locator(MultipleLocator(5))
> ax.xaxis.set_minor_locator(MultipleLocator(1))
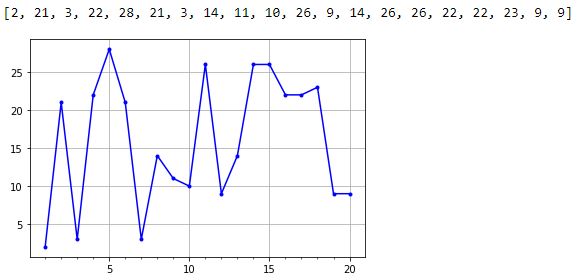
The major and minor tick increments are now 5 and 1, respectively, and the decimal values are gone.
Thus far, the existing code is:
> from matplotlib.ticker import MultipleLocator
> import matplotlib.pyplot as plt
> import numpy as np
> import pandas as pd
> import random
>
> randomlist = []
> for i in range(20):
> n = random.randint(1,30)
> randomlist.append(n)
> print(randomlist)
>
> randomlist_x = list(range(1, len(randomlist)+1))
> fig, ax = plt.subplots(1)
>
> ax.plot(randomlist_x, randomlist, marker=’.’, color=’b’) #plot, not plt
> ax.xaxis.set_major_locator(MultipleLocator(5))
> ax.xaxis.set_minor_locator(MultipleLocator(1))
>
> plt.grid()
> plt.show()
I will continue next time.
Categories: Python | Comments (0) | Permalink

