2021 Performance Review (Part 10)
Posted by Mark on April 26, 2022 at 06:50 | Last modified: February 15, 2022 11:01I left off discussing my ugly 2013 speculative GC trading experiment gone awry. While I paid a lot in “market tuition” to learn some important lessons, at issue here is that the combo index benchmark does not include GC.
Including the GC trades artificially lowers my relative return if coincident GC performance is not incorporated to the benchmark. I’m tempted to just leave it because I believe in erring on the side of conservatism. That’s really not fair to me, though. Besides, as previously discussed I have already assessed the tax penalty on more than I actually made.
The following will result in a combo benchmark (RUT / GC / SPX) with the adjective “index” removed:
- My speculative GC trades run from 2/13/2013 – 5/17/2013.
- According to GC prices at execution, the futures drop from 1648.1 to 1359.6: -$288,500/contract.
- Futures margin during my largest position size is $5,400/contract (increased shortly thereafter per CME website).
- Futures options use SPAN margining, but I do not have historical data on the SPAN stress factors.
- With GC crash volatility, I would guess stress factors to be +/- 15% (if not 18% or more).
- At -15%, requirements are similar to the futures margin mentioned above; this allows me to calculate ROI.
- The combo benchmark performance is then a weighted average of GC and RUT.
- I lump all GC losses into Apr 2013, which is when my big portfolio drawdown (DD) occurred.
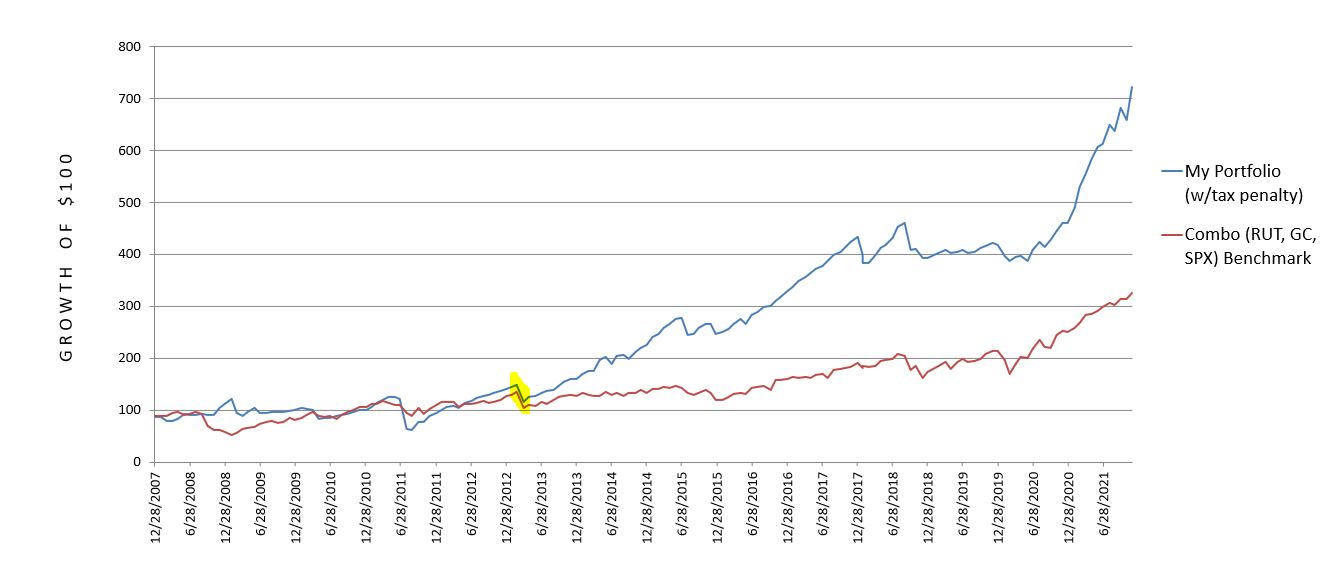
Here is the revised (compare with graphs shown in Part 7) 2008 – 2021 cumulative performance comparison:
My annualized return remains at 15.17%, but the combo benchmark worsens from 10.75% to 8.80%. This boosts my outperformance from 4.42% p.a. to 6.37% p.a. and is a more accurate comparison.
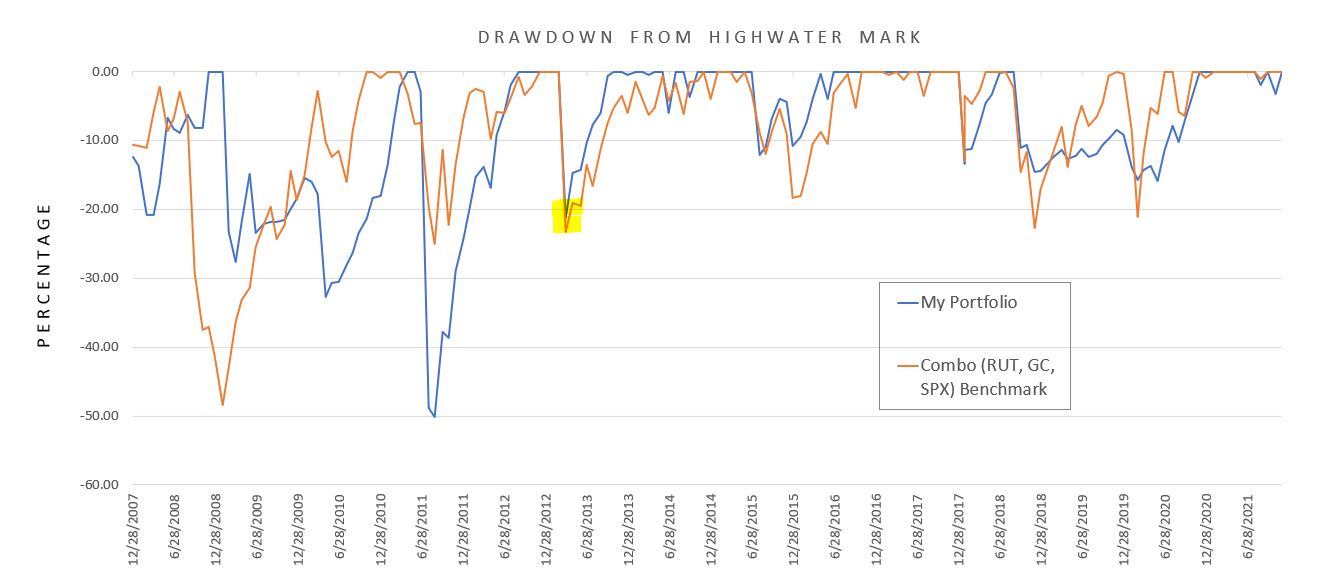
Here is the new DD comparison with major revision highlighted.
My mean DD remains at 8.86%, but the combo benchmark worsens from 7.17% to 7.92%. The max DD is unaffected.
I want to comment on something written here, which I was alarmed to see in preparing for the current performance review:
> I very much like the fact that my worst year was limited to just over a 10% loss.
> This is the kind of stability somewhat lacking to the upside. I experienced three
> catastrophic losses over the last nine years and the overall performance suggests
> I have bounced back quite well.
This is somewhat misleading. Yes, the look from a calendar-year perspective does speak to rapid recovery. It also paints a prettier picture than my current DD calculations that use a monthly time frame. Max DD of 50.10% for me vs. 48.39% for the combo benchmark better reflects the mental anguish suffered at the time.
I will continue next time.

