Questions about CMLViz Trade Machine (Part 2)
Posted by Mark on August 27, 2021 at 07:21 | Last modified: May 30, 2021 10:16Continuing from last time, this is a laundry list of questions, suggestions, and discussion ultimately aimed toward getting clarification about what the CMLViz Trade Machine PRO (TM) offers and what its limitations are.
In the 2019 presentation mentioned in Part 1, Ophir Gottlieb’s response to a question about forward testing is a curve-fitting alert. Someone asked if forward testing could be done and he responded:
> What is forward testing? If I knew the future then I’d certainly trade it (followed by laughter).
Forward testing is a form of OOS validation I described in paragraphs 2-3 here. One of my concerns about Gottlieb’s examples is the possibility of curve fitting to generate overly optimistic results. Remember: this is still a sales presentation.
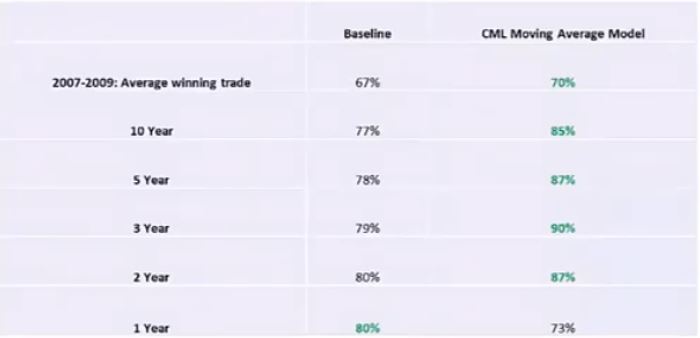
At one point, Gottlieb presents the table to follow. Is it susceptible to curve fitting?
Cherry picking this model over many others that did not show good performance would be duplicitous. I would like to know how many moving average (MA) models did not perform well. To screen out a spike in favor of plateau region (see last two paragraphs here, I would also like to know how MA models with similar parameter values perform.
Curve-fitting caution aside, the table suggests this model works better than baseline in most periods except recent history, which itself was still better than average baseline. I would like to see numbers of trades and, ideally, inferential statistics with correction for multiple comparisons (sixth paragraph here).
The ability to backtest strategies on S&P 500 stocks and to count how many meet customizable performance criteria would be interesting. This might be data mining, though, and unlikely to reveal persistent edges (it usually doesn’t).
Getting back to TM, I would like to be able to customize the trade statistics from a wider variety of potential calculations. What I saw in terms of output is not impressive:
Thinking off the top of my head, I would like to be able to include/exclude:
- Distribution of losses
- Maximum drawdown (MDD)
- Biggest/smallest winner/loser
- Max consecutive winners/losers
- Average days in trade
- Standard deviation (SD) for all, winning, and losing trades
- Average trade
- Average win : average loss ratio
- Profit factor
- Compound annualized growth rate
- PnL/contract-day
- Exposure %
- Risk-adjusted return (perhaps by MDD, SD, or exposure)
A complete listing of potential trade statistics is given in Part 1 and Part 2 of my Automated Backtester Research Plan.
I don’t think it should take a whole lot of programming to make a plethora of trade statistics available. Make us happy and let us play. Too much can never be offered in this area. I would say the same for “export to .csv” buttons: put them anywhere TM generates output because you never know when someone will want to do further processing (e.g. with spreadsheets).
I will finish up next time.
Categories: Backtesting | Comments (0) | Permalink
