Short Premium Research Dissection (Part 31)
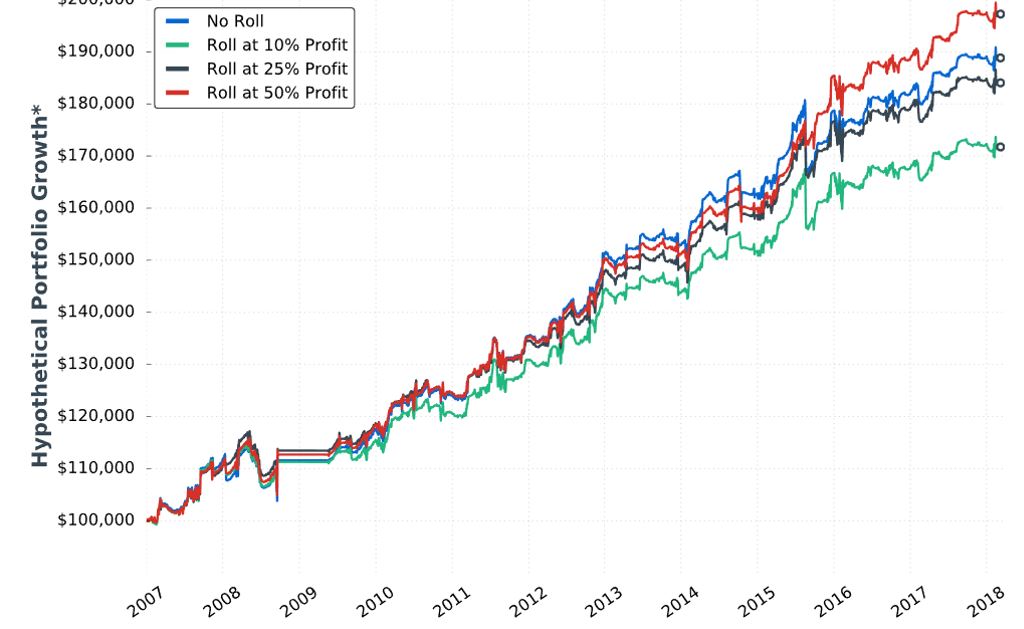
Posted by Mark on June 7, 2019 at 06:55 | Last modified: December 27, 2018 06:30Our author concludes Section 4 with a study of different profit targets. She briefly restates the incomplete methodology and gives us hypothetical portfolio growth graph #13:
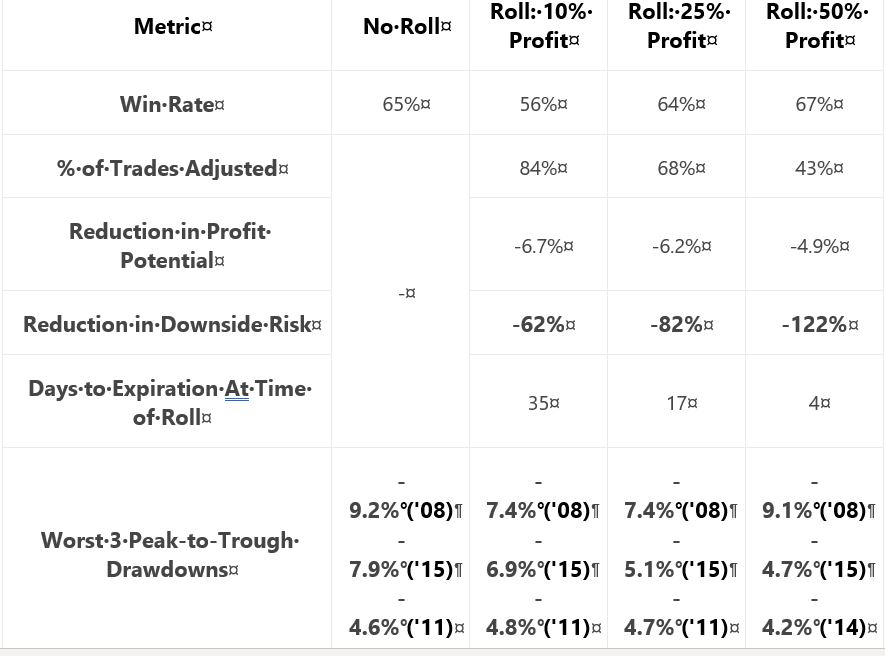
She gives us the following table:
My critiques should be familiar:
- No sample size given
- No inferential statistics provided
- CAGR not given to reveal profitability
- Uncertain DD improvement with four of 18 comparison results unexpected (see second paragraph below table here)
She writes:
> …the downside of waiting until 50% profits is that… long put
> adjustment might not be made at all (which was the case 57%
> of the time), which means the trade’s risk was not reduced. This
> explains why the 50% profit… trigger suffered a very similar
> drawdown compared to… no trade adjustments.
My comments near the end of Part 27 once again apply. This adjustment helps only in case of whipsaw. With the 50% profit trigger, that whipsaw would have to occur inside 4 DTE. If I’m going to bet on extreme PnL volatility, then I would bet on the final four days. However, based on my experience the higher probability choice would be to simply exit at 4 DTE.
I don’t think rolling the put to 16-delta should be part of the final trading strategy. Doing so looks to underperform as shown in the Part 27 graph. If rolling is adopted then, in looking at the above graph, is there any way a 50% profit target adjustment trigger (as opposed to 25%) should not be adopted as well? This would be something to revisit after Section 5 when the completely trading strategy is disclosed.
Criteria for acceptable trading system guidelines should be determined before the backtesting begins as discussed in the second paragraph below the excerpt here. By defining performance measures (also known as the subjective function) up-front, whether to adopt a trade guideline should be clear.
Let’s move ahead to the final section of the report. Our author writes:
> In late 2018, I dove back into the research to analyze
> trade management rules that would accomplish two goals:
>
> 1) Reduced P/L volatility (smoother portfolio growth curve)
> 2) Limit drawdown potential
These should be goals of any trading strategy. Certainly #2 was a focus before because she has talked about top 3 drawdowns throughout the report. I have spent much time discussing it.
I have been clamoring to see standard deviation (SD) of returns as part of the standard battery (see second paragraph here) throughout this mini-series. SD would be a measure for #1.
> In this section, you’re going to learn my most up-to-date
> trading rules and see the exact strategy I use…
What I do not want to see are additional rules added only to make 2018 look better. That would be curve fitting.
I will go forward with renewed optimism and anticipation.
Categories: System Development | Comments (0) | Permalink
