Put Credit Spread Study 1 (Part 2)
Posted by Mark on September 26, 2017 at 05:42 | Last modified: August 1, 2017 08:53Today I will start presenting results for my first put credit spread study.
The global disclaimer is to say no winner really exists in the “best performing trade” competition. What is most meaningful to me may be less meaningful to you. This is why alignment between a trade strategy and individual personality is so important. All I can do is explain my interpretation of these numbers. You will have to do the same.
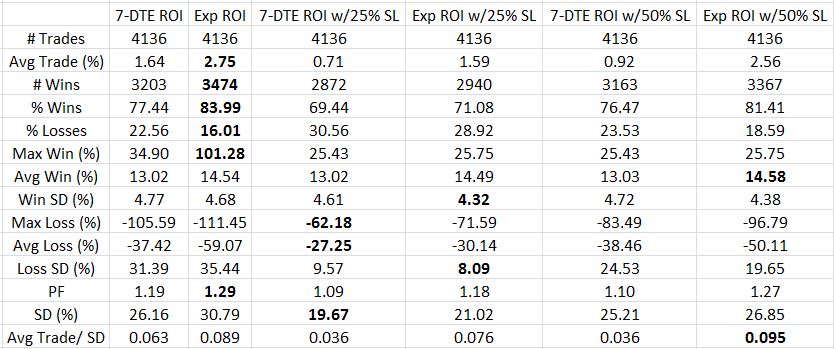
Here are the results for TF = $0.26 using net MR (see last post for explanation of table contents):
The first thing I look at is PF followed by risk-adjusted return. Exp barely edges out Exp w/50% SL for PF and vice versa for Avg Trade/SD. I would therefore trade Exp w/50% SL because this gives me a better chance of avoiding the biggest losses. Looking at the SD data gives me pause because I really like seeing drawdowns minimized. Perhaps a better comparison to put this in proper context would be to compare against $4,000 of long shares daily (as done in the last link).
Given the choice between exiting trades at 7 DTE or Exp, the latter seems to outperform. Avg Trade, PF, and Avg Trade/SD all reflect this in the comparisons between rows 2 vs. 3, 4 vs. 5, and 6 vs. 7.
Two things are missing from this rationale, though, with the first being max loss. 7 DTE has smaller max losses than Exp each time. That makes sense with the rapid option decay of the final week. Max loss can significantly limit position size. In thinking about strategies with max loss -100% vs. -50%, I would trade the former much smaller. Do remember, though, that in trading like I backtest my position size would be relatively small simply in virtue of putting a new trade on every single day. This not only gives me a large sample size but it also dilutes drawdowns.
Especially in thinking about this “perpetual scaling” approach, the risk-adjusted return is more important to me than max loss. As mentioned, expiration outperforms 7 DTE every time.
The second missing piece from the performance comparison is trade duration. The expiration trade is seven days longer. Annualized ROI would be one way of factoring this in because the same average trade would have a lower ROI per year if held to expiration than 7 DTE. PnL per day would be even more direct.
Next time I will study the impact of TFs.
