2016 Performance Update
Posted by Mark on March 16, 2017 at 07:10 | Last modified: October 13, 2017 11:04I am very past due for a performance update.
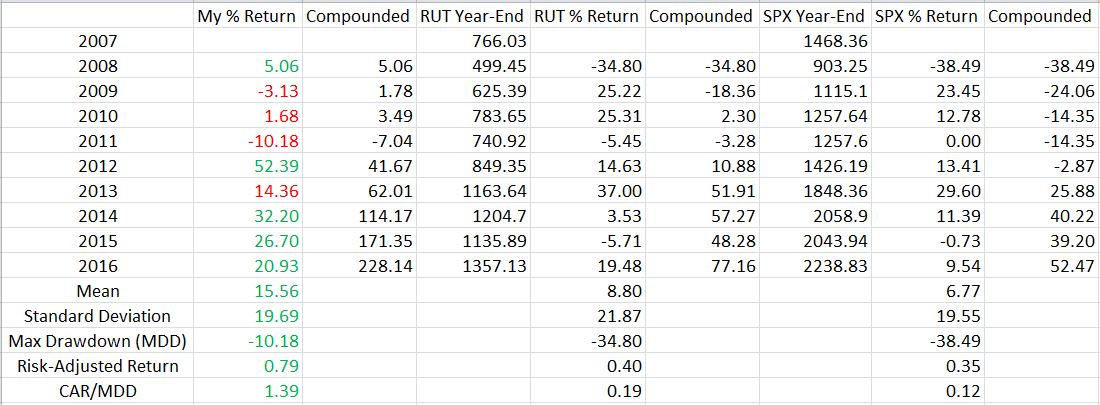
I will focus discussion on the following table:
My first full-time year was 2008, which means I now have nine years of trading history. Through that time I have tried a few different things, backtested a lot, and learned tons. Hopefully I have learned most from my mistakes. Only the future can reveal whether that is true.
The table includes three sets of data. I start with my yearly performance and the compounded total return. I then repeated these calculations for the small-cap and large-cap indices. Green (red) numbers indicate where I outperformed (underperformed) the benchmark. Standard deviation is a measure of risk (as discussed here and here) along with max drawdown (MDD) (as discussed here). Risk-adjusted return is total return divided by standard deviation. CAR is compound annualized return, which makes CAR/MDD another risk-adjusted metric.
I have outperformed the benchmark in five out of nine years.
I have generated profit in seven out of nine years.
My average return significantly outpaces the indices. Mostly for that reason, the risk-adjusted returns are much better too.
My biggest disappointment is the relatively high standard deviation. To this end, my 2012 return of +52.39% hurts. I can’t say exactly what was going on with my trading that year without looking back and scrutinizing the records. Yes it’s a great number but my preference would be to have stable returns like I have the last few years.
I very much like the fact that my worst year was limited to just over a 10% loss. This is the kind of stability somewhat lacking to the upside. I experienced three catastrophic losses over the last nine years and the overall performance suggests I have bounced back quite well.
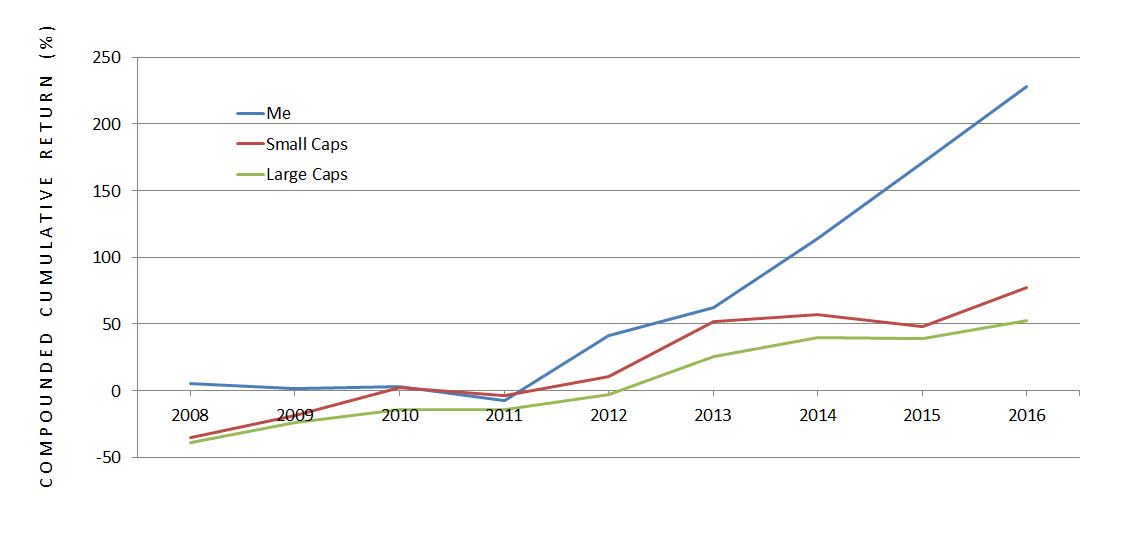
Graphically, the comparison looks like this:
The outperformance is clear.
Although I was in negative territory and underperforming after four years, my preference is to have a relatively flat equity curve in volatile markets as opposed to a curve more jagged than the coastline of Buzzards Bay, MA. This is something I have managed to accomplish thus far.


Comments (1)
[…] couple months ago I did a long-awaited performance update. Today I want to focus on the last part of that […]