Dynamic Iron Butterflies (Part 5)
Posted by Mark on February 16, 2017 at 07:28 | Last modified: February 2, 2017 09:40Better execution can definitely improve profitability of the dynamic iron butterfly (DIBF). This makes me wonder about placing the trade and just leaving it to sit until filled.
Analysis of the maximum adverse excursion (MAE) can help to study this. A losing trade could almost always have been filled at a better price. Out of 3968 backtrades, 736 never get down more money than they are at trade inception. Minute-to-minute volatility in the markets is much greater than day-to-day (seen in my EOD backtest) volatility, which provides hope that most of the 736 would eventually fill. This is no guarantee, however, and 18% includes a big opportunity for otherwise winning trades to go unfilled thereby depressing total return.
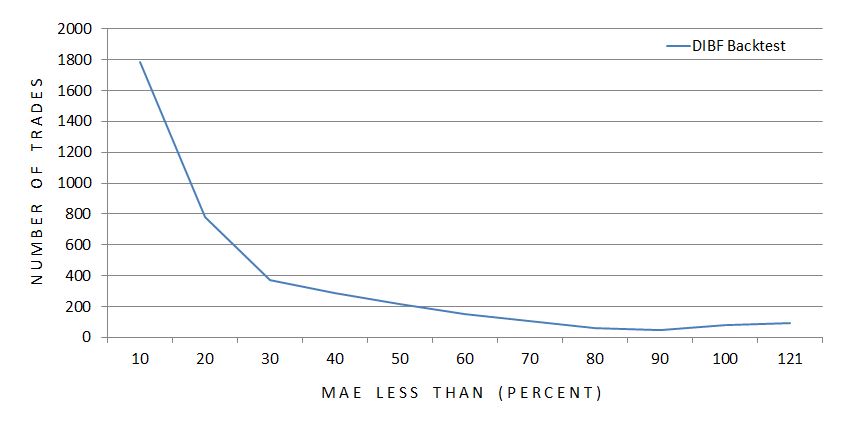
Here is the complete MAE distribution across 3,968 backtrades:
The x-axis indicates the maximum MAE seen for each particular grouping of trades. The first data point includes all trades with MAE less than 10%, the second data point includes all trades with MAE of 10% up to 20%, etc.
The graph illustrates a majority of trades never get down a whole lot.
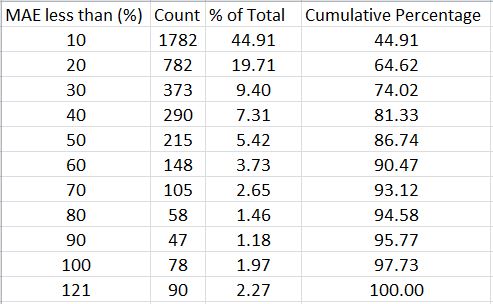
Here’s the same information packaged somewhat differently:
With a profit target of 10%, over 64% of all backtrades never get down more than 20% and over 86% never get down more than 50%.
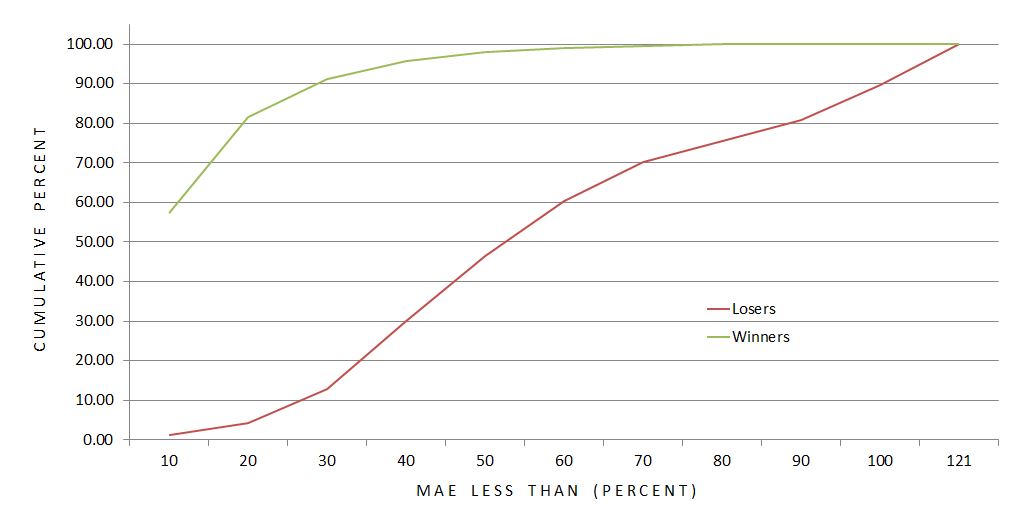
This suggests a potential benefit to using a stop-loss. I still need to better understand how many winners would be affected, though. How does the MAE distribution compare between winning and losing trades?
This graph shows the difference to be significant. Over 91% of winners never get down more than 30% compared to just under 13% of losers. The average MAE for winning (losing) trades is 12.9% (57.9%).
Over 98% of winning trades are never down more than 50%.
Is a 50% stop-loss worthwhile?
The cost is conversion of 59 winning trades into certain losers ranging anywhere from 50-90%.
The benefit is an opportunity to save money on 467 trades that would otherwise lose up to ~100%.
This sounds like a reasonable trade-off to me since the number of trades potentially benefitting is eight times the number to suffer a worse fate. And even if the overall return does not improve, cutting down the biggest losers would still reduce the standard deviation of returns, which is a measure of risk.
Confirming this would involve collecting revised loss data on 526 backtrades with MAE over 50%. I should also backtest the surrounding parameter space by checking stop-loss thresholds like 10%, 20%, etc. This could be an awful lot of work…
But who ever said making a business out of trading should ever be easy?
Categories: Backtesting | Comments (1) | Permalink

