Cost of Doing Business (Part 2)
Posted by Mark on January 30, 2017 at 07:31 | Last modified: November 23, 2016 11:19I believe clients pay millions of dollars every year to have money invested less effectively than they could do themselves. Rather than seeing this as financial-industry brainwashing, however, it may be a simple cost of doing business.
Two necessary components must be in place if the financial industry has indeed perpetrated a brainwashing of the American public. Even if the vast majority of people believe in domain-specific expertise, “brainwashing” implies a widespread propaganda campaign run by the financial industry. I’ve had some casual conversations with investment advisers and I read financial journals regularly. The brainwashing assertion seems too far-fetched for me to accept.
Here is a more positive perspective: investment advisers work as intermediaries. If I am going to pay someone else to replace my brakes then I will pay more to have it done. Similarly, if I am going to hire an adviser or fund operator (by purchasing shares) to invest my money then I will pay more to have it done. The added cost comes in the form of management fees, operating expenses, and lower returns as a result of less-efficient strategies.
Neither financial professionals nor the financial industry are to blame in this new paradigm. The industry is doing what clients ask them to do: invest money. Compared to the alternative—leaving money in savings accounts or under the mattress where inflation-adjusted returns are negative—the industry is doing a good job. Financial professionals may not match the performance of self-directed investors but time is required to learn and to do it for oneself. What you gain from being self-directed is partially offset by the time and effort committed.
In the new paradigm, this is about sweat equity. Those skilled at the trades (e.g. carpentry, plumbing, electrical) are in a good position to invest in real estate because they can fix things cheaper and realize a lower cost basis on property. Those with a penchant or aptitude for math and finance can invest/trade and realize a lower cost basis as well. Those who don’t must leave it to the professionals. In doing so they will pay a premium to have done what they can’t do themselves.
And they will be willing to pay the premium because that is how our capitalistic society works. It doesn’t have to be about manipulative brainwashing; it can simply be about appreciation and gratitude for a service.
Categories: Financial Literacy | Comments (3) | PermalinkCost of Doing Business (Part 1)
Posted by Mark on January 27, 2017 at 06:07 | Last modified: November 23, 2016 08:59Long-time readers may not be surprised to hear that I am sometimes jaded and skeptical of the financial industry (e.g. optionScam.com). Seen differently, however, perhaps this is just the cost of doing business.
According to some of my teachers/mentors over the years, the financial industry has brainwashed the public at large. People believe investing is an important, responsible enterprise that is best left to the [financial] professionals. I agree with the former and disagree with the latter. I believe many financial/investment advisers are glorified salespeople who push products their firms are contracted to sell. I discussed this in detail here.
Along these lines of thinking, the financial industry has brainwashed society to pay more and expect less. A standard management fee has traditionally been 1% of assets under management per year. In exchange, savvy clients have expected to beat the benchmark.* This means when the benchmark loses money, clients should remain satisfied as long as they do not lose more. Paying someone to lose money that you could lose yourself is anathema to me.
Financial brainwashing also includes the acceptable sale of inefficient services. This involves getting clients to pay up for less-efficient investment strategies than what they could employ on their own (think long stock instead of trading options). Society seems to be comfortable with and accepting of this.
I occasionally seem so down on the financial industry! I feel like a closet conspiracy theorist and I do not like it. My preference is to be positive and encouraging about things.
The time has come to challenge the assertion that society has been brainwashed. A cursory evaluation reveals two components that must be present for this brainwashing to have taken place.
The first component would be a widespread belief that the financial industry has a proprietary edge. Truth be told, I have little understanding what the “public at large” thinks about financial matters and I doubt I’m alone on this. The issue to survey is whether investing success is a result of domain-specific expertise or simply a matter of having the right education. Domain-specific expertise might involve professional research teams able to cover a large number of companies/industries or professional stock pickers powered by innate talent and lengthy experience: forms of expertise no laypeople could develop on their own.
I will continue this discussion in my next post.
* This is changing with the promotion of passive/indexing investment strategies, which always fall a bit short.
Financial Secrets (Part 2)
Posted by Mark on January 24, 2017 at 06:44 | Last modified: November 7, 2016 16:42Today I will conclude with excerpts from Dr. Sarah Newcomb’s article in the Sep 2016 AAII Journal.
> Financial skills are not easily learned when
> communication is opaque, and experience can be
> a ruthless teacher. Leaving loved ones to
> learn about money management ‘the hard way’
> may mean they learn too late, or not at all.
> Remember that even a third-tier topic of
> conversation is perfectly acceptable to
> discuss with intimate relations. Neglecting
> to speak out on financial matters with
> spouses and loved ones may well be an act of
> avoidance rather than tact. If we want to
> leave a legacy of strength and stability, we
> be brave enough to challenge the culture of
> silence and speak plainly with our loved
> ones about money [italics mine].
Dr. Newcomb later mentions data from an American Express study:
- 91% of couples avoid discussing money with their partner
- 80% of couples have at least one partner actively hiding financial information from the other
- 50% of baby boomers claimed never to have discussed money with their children
- ~70% of parents claimed to feel more comfortable talking with their teens about sex than about investing
Dr. Newcomb goes on to say:
> Silence may be comfortable today, but our
> spouses and children will feel the impact
> of our financial legacy when we are gone.
> Rather than bequeathing confusion and
> hardship, opening the door to financial
> discussions can help prepare them for that
> more difficult transition. The same holds
> true when your financial picture is bleak.
> Sheltering loved ones from difficult
> realities will not help them cope.
> Speaking the truth, however painful, is
> more loving than presenting a pretty
> falsehood.
I suspect Dr. Newcomb has some powerful lessons for all to learn in her words on this topic.
And on the grand scale, I feel the financial industry promises too much while delivering too little. This takes place at a self-perpetuating cost that people happily pay because the opacity of the subject matter blocks them from knowing any better.
Categories: Wisdom | Comments (0) | PermalinkFinancial Secrets (Part 1)
Posted by Mark on January 19, 2017 at 06:32 | Last modified: November 7, 2016 16:27To me, the phrase “financial secrets” immediately connotes fraud. I would invite you to read some of my previous posts to find out why. Somewhat ironic is the observation that financial details are held with such secrecy in our society today.
Dr. Sarah Newcomb, author of Loaded: Money, Psychology, and How to Get Ahead Without Leaving Your Values Behind (2016) wrote an interesting article on this subject in the Sep 2016 AAII Journal. I will post some excerpts and [minimal] commentary:
> We don’t talk about money.
>
> According to “Emily Post’s Etiquette,” money is
> a third-tier topic of conversation, putting it
> a full class above sex and religion in terms of
> inappropriateness to discuss in mixed or casual
> company. Especially among those with wealth, the
More taboo a topic than sex?! This is shocking to me.
> unspoken laws of society dictate that we maintain
> a dignified silence on this important, but often
> divisive, topic…
>
> …the purpose of etiquette is to avoid any cause
> for pain, embarrassment or offense. Yet our
> reticence on financial matters is so pervasive
> that it extends to those who would often greatly
> benefit from open communication. In many cases,
Those of you who have been reading for a while know I’m fairly convinced that options are better than stock. I therefore feel like I walk around with a huge secret about what I do—a secret that suggests most of the financial industry is wrong and does a disservice to its clients by not employing options as an investment vehicle. Because we are so hush-hush about money, this is not something I feel comfortable coming right out to say.
> well-intentioned civility leads directly to the
> financial harm, or even ruin, of those we care for
> most.
Namely my parents. For years they have invested with a money manager who I believe has failed them. The upside to keeping silent and letting them do their own thing is that I avoid the burden of losses that could result from the market turning ugly. The downside is watching them throw away money year after year to generate subpar returns.
I will finish this discussion in the next post.
Categories: Wisdom | Comments (1) | PermalinkNaked Put Study 2 (Part 9)
Posted by Mark on January 10, 2017 at 07:24 | Last modified: October 21, 2016 12:56Today I will tie up a couple loose ends regarding NP Study 2.
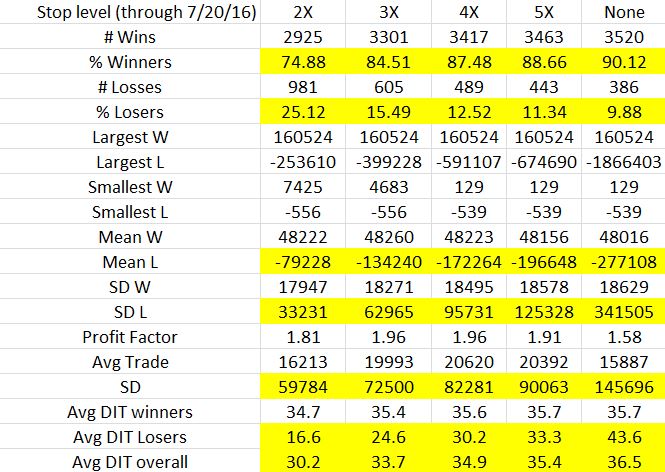
First I present overall trade statistics stratified by stop level:
Cells that show trends from low (tight) to high (loose) stop level are highlighted:
- The looser (tighter) the stop, the higher the winning (losing) percentage
- The looser the stop, the higher the average loss and standard deviation of losses (more extreme outliers)
- The looser the stop, the higher the overall standard deviation of trades (more extreme outliers)
- The looser the stop, the longer the average losing trade and overall trade (stops shorten what would otherwise be trades taken to expiration)
Average trade and profit factor both peak at the 4X stop level. I find this interesting because net return / maximum drawdown (MDD) peaks at the 2X stop level. To me, that was a pretty compelling case to use 2X.
Which statistics are more meaningful in this comparison brings us to the second loose end: my previous mention about Monte Carlo simulation. The trade statistics shown in the table above are based on 3,906 trades. The MDD is based on just one possible selection of trades. If I stick with the percentages and run multiple simulations with replacement then I can take averages of the MDD and other portfolio parameters. I think this would be very insightful.
I go back and forth as to whether the Monte Carlo simulation should be done with or without replacement. To give me the most confidence in trading the system, I want to select the method that is more likely to underestimate returns. In thinking back over the last 15+ years, we have seen some unlikely (multiple standard deviations) market crashes. Simulating with replacement could result in a higher or lower number of extreme losses. Simulating without replacement will result in the same number of losses in random order. This means the MDD will vary depending on the extent to which losing trades become grouped together.
I doubt any blanket answer to this question exists. I should probably do 10,000 simulations each way and see how they compare.
Time to brush up on MS Excel…
Categories: Backtesting | Comments (0) | PermalinkNaked Put Study 2 (Part 8)
Posted by Mark on January 5, 2017 at 06:46 | Last modified: October 19, 2016 12:04I left off analyzing stop-loss data for naked put study 2.
In particular, I noted the importance of the net-return-to-max-drawdown (DD) ratio. In looking at the 2x vs. 5x stop levels, for example, the difference in net return is not that big at 27%. The difference in DDs is big and combining the two as ratios reveals a 2.11-fold difference.
By proportionally changing position size to normalize DDs, we can better see DD impact as risk-adjusted return:
The last column sums it up. Even the loosest stop (5x) led to a 180% performance improvement. The tightest stop led to improvement far better than that.
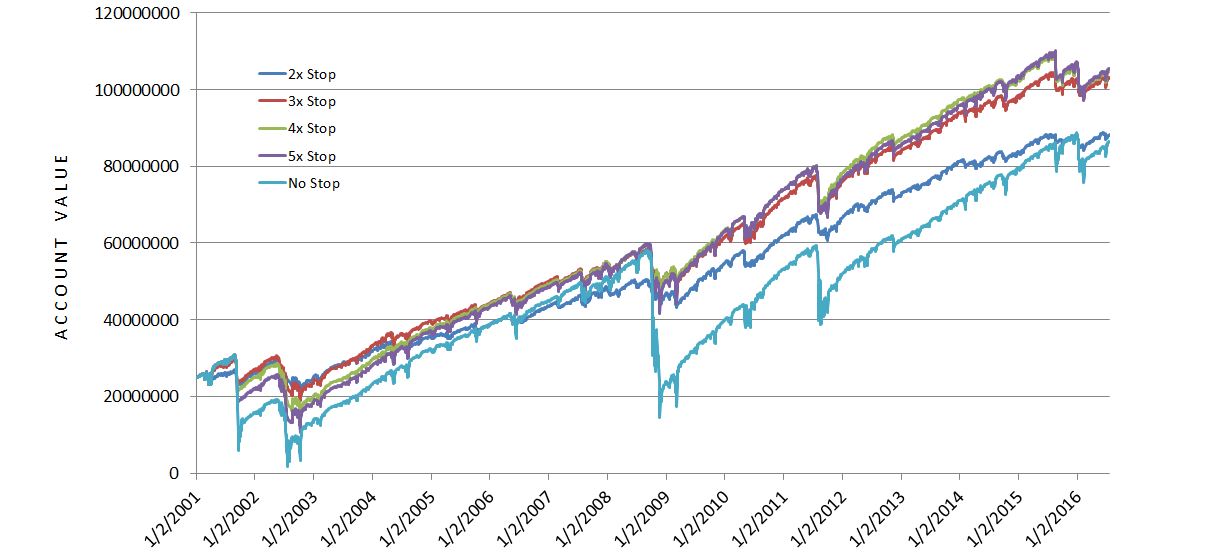
Graphically, backtested performance looks like this:
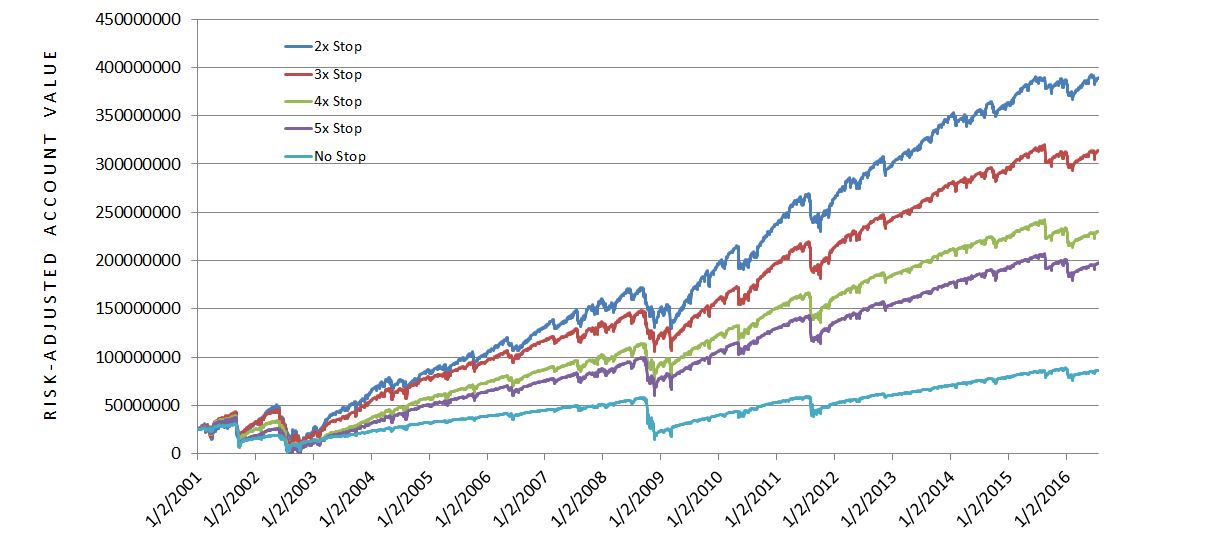
Here is the same graph normalized for maximum DD (risk-adjusted):
The worst DD occurred during the 2008 financial crisis. If you look closely at that part of the graph then you will see comparable losses.
Outperformance can result from trading a system with greater net returns. Outperformance can also be achieved by selecting a system with lower DDs. Lower DDs allow for larger position sizing, which also leads to greater net returns.
Just out of curiosity, I ran some numbers to see if max DD was proportional to stop levels. In other words, did the max DD at 3x exceed that at 2x by 50%? Was the max DD at 4x 20% less than the max DD at 5x? Six comparisons were done: 2x vs. 3x, 2x vs. 4x, 2x vs. 5x, 3x vs. 4x, 3x vs. 5x, and 4x vs. 5x. The 5x max DD was just barely less than 25% more than the 4x max DD. In the other five cases, though, the max DD was more than proportionally greater for the higher stop level.
I really have no meaningful conclusions to draw from these comparisons. I thought it might be a bonus benefit if the higher stop levels were accompanied by less-than-directly-proportional max DDs but this was not the case. These comparisons were based on one data point (max DD). What might be more useful would be to look at average loss (mark-to-sale multiple) for each stop level. This would represent a larger sample size.
Along these lines of small sample size, I also regard the equity curve comparison to be limited. While the graph looks impressive as summary data of a 15-year backtest, it is only one possible equity curve generated by this system. At the least, in other words, these equity curves represent a single ordering of trades. In the future I would be interested in doing a Monte Carlo simulation to study the distribution of net return and max DD values. Whether to do the simulation with or without replacement of daily equity changes is something for further consideration.
Categories: Backtesting | Comments (0) | PermalinkNaked Put Study 2 (Part 7)
Posted by Mark on January 2, 2017 at 07:26 | Last modified: October 19, 2016 09:36What better way is there to break in the New Year than with new data? Today I continue analysis of naked put (NP) study 2 by studying the efficacy of stops.
I previously presented data comparing the naked put (NP) trade with long shares. This suggested outperformance by NPs. A drawdown analysis added complementary evidence. From there I went on to study the equity moving average as a potential filter for when to be in the trade. That was not encouraging.
Stop-losses are another potential means to improve the trade. Stops help avoid the largest losses at the cost of more frequent smaller ones. Stops result in trade exit, though, which shuts the window of opportunity for trade recovery (“whipsaw”). In theory, avoiding the most catastrophic of losses offers a better chance of long-term survival.
I therefore repeated NP Study 2 using end-of-day (EOD) stop-losses. Stop levels tested were multiples of the original credit. EOD implies the possibility of realizing a 4x loss even under a 2x stop condition (good future blog topic).
Let’s start with some vital statistics:
Return numbers are shown in the first two rows (not including header). The stops seemed to help. Net return without stops was the lowest. Looser stops (higher stop level) then resulted in greater returns.
Maximum drawdown (DD) is shown in the third row. No stops resulted in the largest max DD. Tighter stops resulted in the lowest max DD. This is precisely the reason stops are advertised.
Remember that DD helps to determine position sizing. I have written about this in terms of psychic pain. For these reasons, a system with lower DD is worth considering. I have a greater chance of sticking with such a system through tough times because I may not lose as much.
For these reasons, I included row 4 as a ratio of net return to maximum DD. It turned out the tighter (lower) the stop, the larger the ratio. Even the highest stop level has a ratio that is 2.8 times larger than using no stops at all.
I think this is huge.
Categories: Backtesting | Comments (1) | Permalink


