Mean-Reversion Study (Part 2)
Posted by Mark on February 12, 2016 at 06:06 | Last modified: June 1, 2017 13:41Last time I described the methodology for a mean reversion study. Today I will discuss results.
The data for this study span Feb 2001 through Oct 2015.
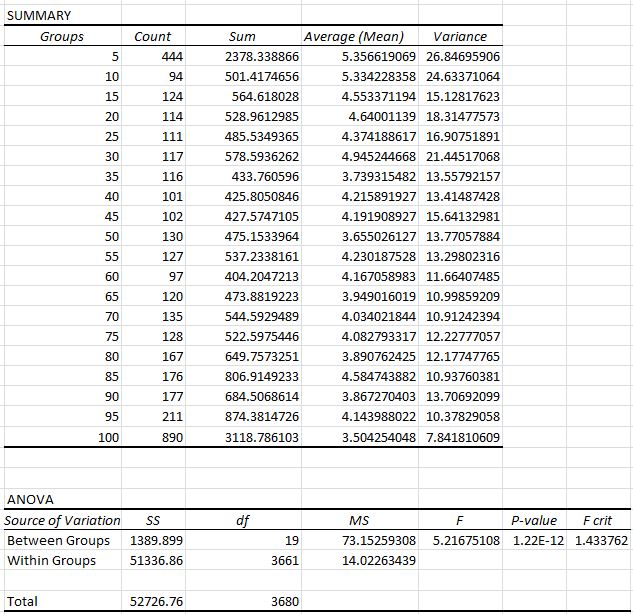
Here are the ANOVA results for MFE:
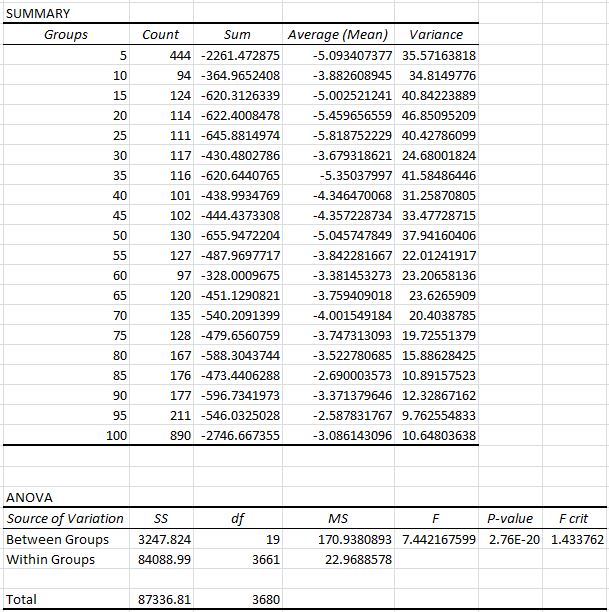
Here are the ANOVA results for MAE:
The first thing I noticed were the F-values > 5 and > 7 along with the corresponding p-values on the order of 10-12 and 10-20. Based on what experience I have in scientific research those numbers are extreme. This is probably to be expected with a large sample size (n = 3681). This tells us the averages across groups are statistically significant. Further testing would be required to determine where the differences lie, however. Some averages may differ while others may not.
Next, look at the “Count” column. The values are going to be the same for MFE and MAE because they come from the same data set. I was surprised to see the highest values at the extremes: 444 days printed an Osc reading < 5 and 890 days printed Osc > 95. This is 36% of the data in 10% of the groups. We could say this is why the market is often characterized as “taking the escalator” on the way up and “jumping out the window” on the way down: the ascent is long and gradual while the decline is often short and sharp.
Finally, the trend of both MFE and MAE values seems to decrease in magnitude as the market goes from oversold to overbought. More specifically, MFE is greatest when oversold and least when overbought. This suggests mean reversion. MAE, however, is most negative when oversold and least negative when overbought. This suggests trend-following. Taken together, we could just say the market is most volatile to the upside and downside when it is oversold and least volatile when overbought.


Comments (1)
[…] As I pointed out, I would not conclude mean reversion from these data. If it’s mean-reverting in one direction and trend-following in the other then something else is taking place. The simplest answer seems to be volatility. […]