Naked Puts (Part 8)
Posted by Mark on December 10, 2015 at 05:38 | Last modified: November 5, 2015 07:15I want to go in another direction today and consider exactly how I might go about doing the naked put trade, which really becomes a question about position size.
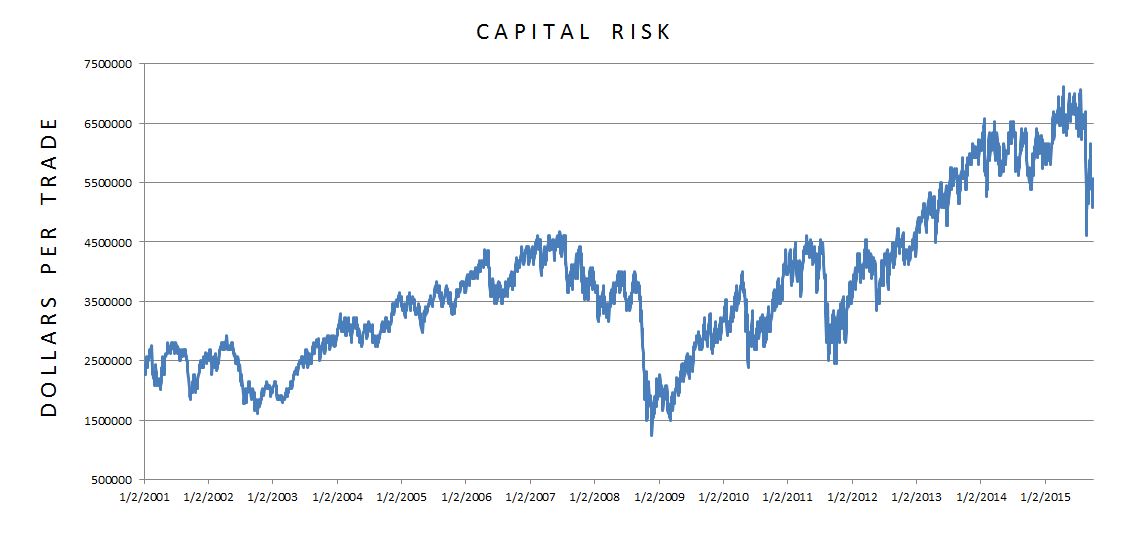
As I prepared the initial graph comparing naked puts with long shares, I became aware how much capital risk this arbitrary position size was commanding:
The graph illustrates two important points:
(1) This is not a constant capital-risk trade
(2) Capital risk is extremely large.
With regard to backtesting, (1) is very important. Position sizing should be held constant throughout the system development process. This allows for an apples-to-apples comparison of PnL changes throughout the period of study. A drawdown (DD) at any point should be evaluated as if it occurred from Day 1; this is one way of interpreting maximum risk.
Even though capital risk did not remain constant, contract size did and for that reason I believe the backtest is acceptable. I had a gross dollar target range for profit and maximum loss that remained constant regardless of underlying price. Leverage, being directly proportional to capital risk, is what changes. This is a difficult concept to understand.
With regard to (2), it especially became evident how large capital risk is when I realized the graph shows one trade at a time. With an average of 27.6 days in trade, I can multiply the average capital risk by 27.6 to get an estimate of how much capital risk is on at any given time. Over the 14+ years that number is $103M each day!
To personalize this trade, clearly I have to cut down the position size and then make some decisions about whether the return potential vs. expected DD is acceptable for me.
Categories: Backtesting | Comments (3) | Permalink