Naked Calls
Posted by Mark on November 10, 2015 at 07:14 | Last modified: October 31, 2015 12:18I have spent many hours backtesting naked calls and I now want to analyze these data. The question I ultimately look to answer is whether this trading approach offers any edge.
I backtested from January 2, 2001, through September 21, 2015: 3,695 trades total.
74.7% trades (2,760) won.
25.3% trades (935) lost.
Mean days in trade was 24.39 with a standard deviation of 11.87.
Mean profit on 2,760 trades was $2,994.65 with a standard deviation of $835.
Mean days in winning trade was 25.92 with a standard deviation of 11.12.
Mean loss on 935 trades was $9,601.91 with a standard deviation of $3,420.
Mean days in losing trade was 19.87 with a standard deviation of 12.82.
Average trade: -$192.84
Average annual loss: -$2,886.20
Profit factor: 0.92
To say “this does not seem very encouraging” is understatement of which even Ernest Hemingway would be proud.
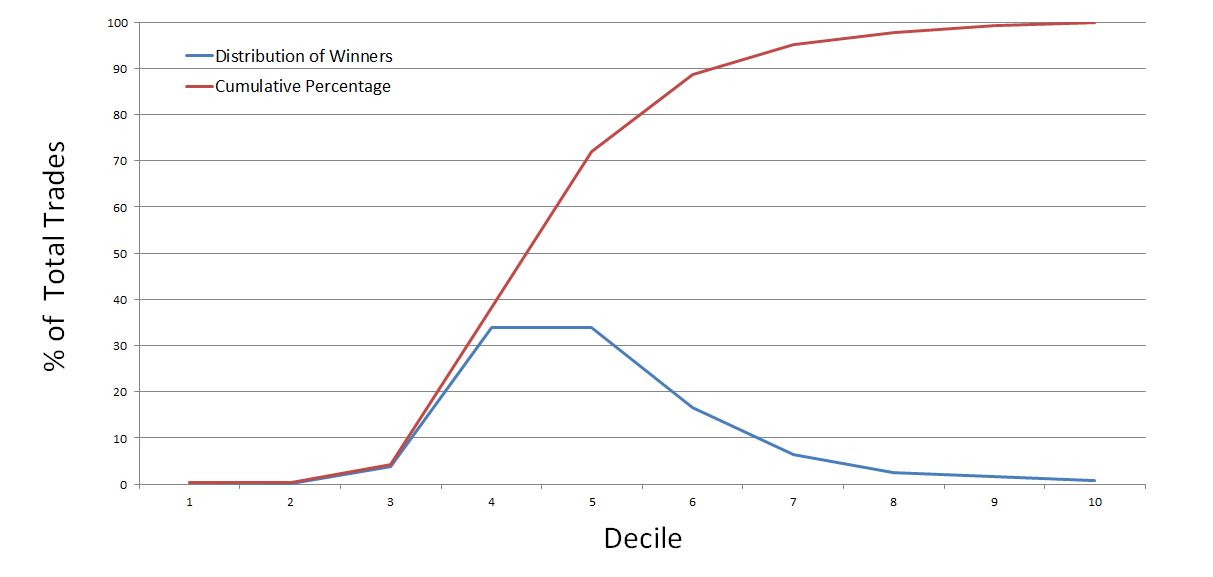
The graph below shows the distribution of winning trades:
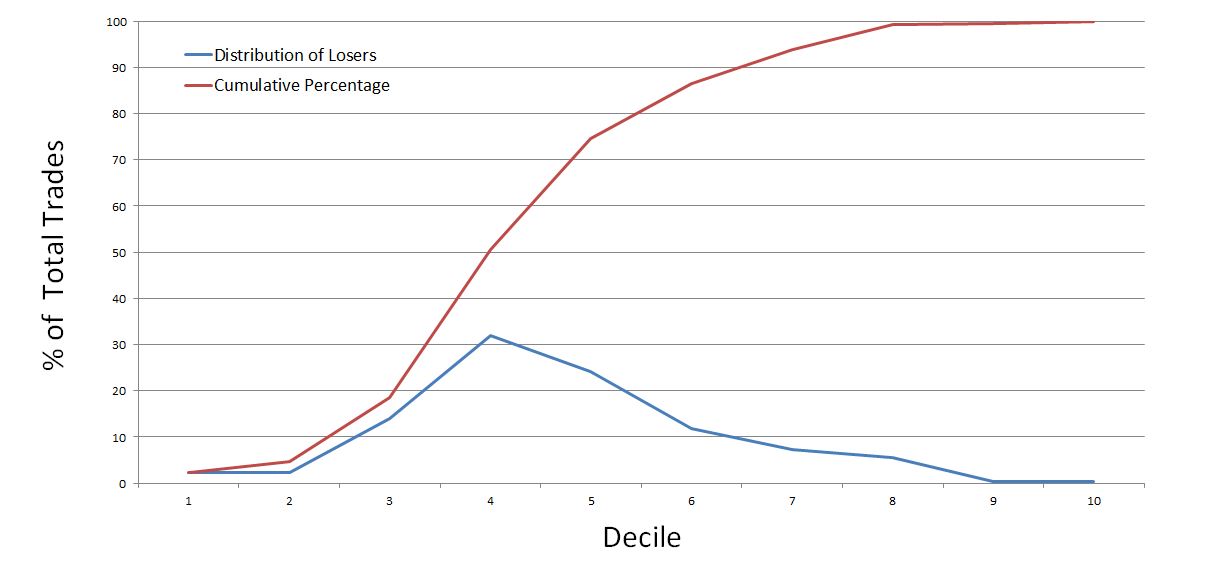
The graph below shows the distribution of losing trades:
Do you see anything here that might offer even the slightest of hope?
I do find it interesting that the four deciles of largest losses (in excess of $13,584 per trade) account for less than 14% of the losing trades.
Intuitively, I’d like to see this significantly larger than the four deciles of largest gains (in excess of $4,624 per trade) but those account for a comparable amount at 11.4% of the winning trades.
A couple other observations further dim the light on hope. First, the losses are not maximum adverse excursion (MAE): the practical statistic that really matters. Second, it’s important to note this was an end-of-day backtest, which means results can be lumpy. A trade can go from decile 2 to decile 7-10 in a single day.
I may run the MAE analysis later but I really have little hope for a system with a negative expectancy to start (profit factor < 1.0).
Categories: Backtesting | Comments (3) | Permalink
