Covered Calls and Cash Secured Puts (Part 10)
Posted by Mark on November 14, 2013 at 07:05 | Last modified: January 15, 2014 08:51In the last post, I discussed volatility of returns. This is a measure of risk and the lower the volatility, the larger a position size I can feel comfortable trading. This seems to be the biggest benefit to trading CCs and CSPs especially when comparisons are done over different time intervals.
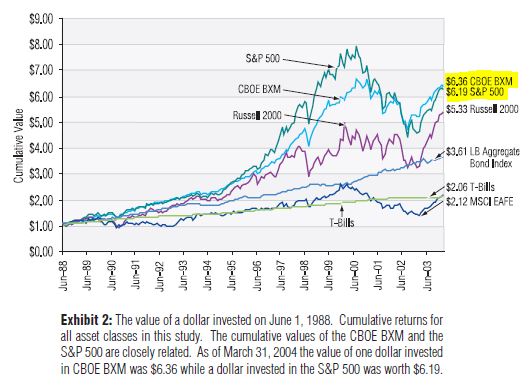
Taken from the Ibbotson study mentioned in my last post, the following graph shows performance between 1985 and 2003:
Here, $BXM (CCs on S&P 500) matches S&P 500 as measured by absolute returns and outperforms with regard to volatility. Volatility is harder to see on the graph but notice where the index goes way up in 2000 and then bottoms in 2002, $BXM didn’t go as far up and bottomed in the same place. This is lower volatility.
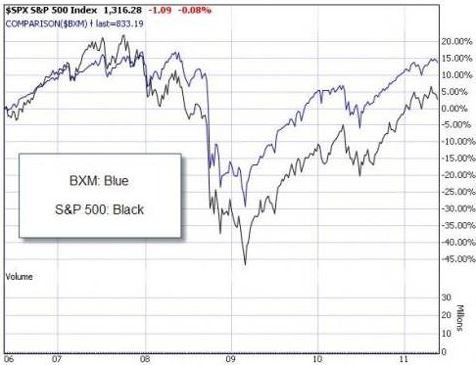
Below is a shorter time interval from 2006 to 2011:
Here, $BXM outperforms S&P 500 in terms of absolute returns and volatility. Once again, volatility is harder to see but notice how $BXM was lower than the index in 2007 and dropped less to its bottom in 2009. This is lower volatility.
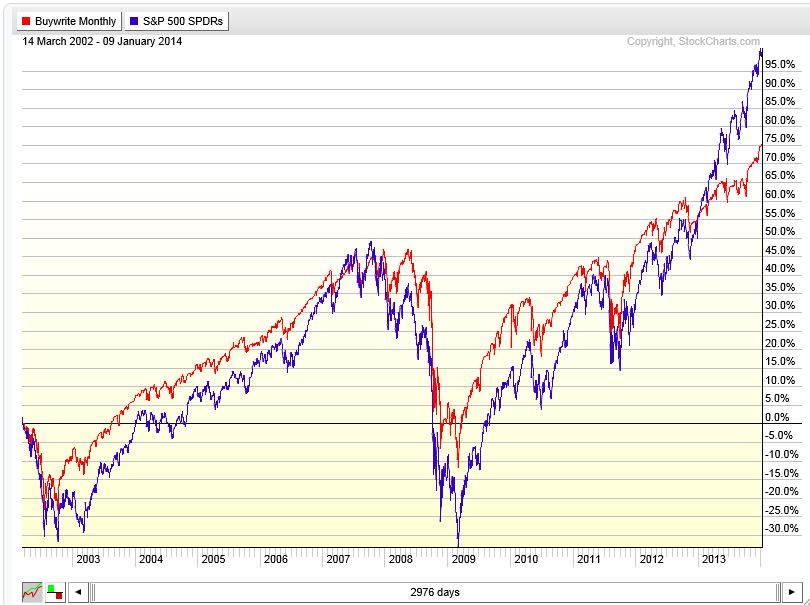
Finally, the following graph from 2002 to recent times shows something different:
Here, $BXM outperforms with regard to volatility and underperforms as measured by total return. From a similar level in 2007, $BXM dropped less through 2009 and then rallied less through 2013 as the market reached all-time highs. This is lower volatility. Investors cheer the greater S&P volatility in this case because it is upside volatility.
While investors like upside volatility and despise downside volatility, we really don’t get to choose. Times like the present make it feel like we get to choose and like we are making the right investing choices but this is the “fooled by randomness” argument that I can take up in a future post.
Today’s post shows three different time intervals for comparison between S&P 500 and $BXM. While CCs tend to post equal to lower returns during bullish market environments, they display a lower volatility of returns in all market environments.


Comments (2)
[…] my last post, I showed graphical comparison of CCs ($BXM) and outright stock (S&P 500 index) over three […]
[…] piece of evidence is anecdotal study of risk as volatility of returns. I cited studies here and here suggesting that returns are similar between stock and option positions with volatility 33% lower […]