Option Volatility and Pricing (Part 2)
Posted by Mark on November 27, 2013 at 06:12 | Last modified: January 20, 2014 09:35In my last post, I took a detour to explain some basics about option pricing and volatility.
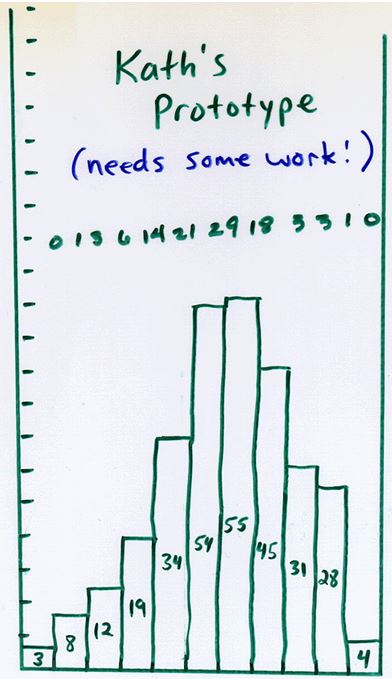
In that discussion, I showed an experimental 100-trial simulation of the Price and Right “Plinko” game, which simulates a random walk. If we run many such 100-trial simulations and combine the results then we will see something like this:
These chips are much like stocks, which have a near-equal chance of going up or down on any given day. Most option pricing models assume future stock price to be distributed in this fashion. Since people trade based on these pricing models and since trading theoretically affects price movement, it seems logical that future prices will more or less follow the Normal distribution (bell curve as shown above).
As I write this, two questions pop into mind.
First, do stock prices really follow these tendencies?
We could conduct a backtest to answer this question. We might randomly select a large number of stocks and note the average IVs. We could then look at price changes over a predetermined time interval and convert those to SDs. If the theory holds then the SD distribution should approximately follow the bell curve.
This backtest is much easier said than done. We might want to look at some different market environments. We might want to diversify across sectors or asset types. We should be sure to include stocks that have become worthless (corporate bankruptcies). The considerations are numerous.
Assuming the bell curve is an accurate description for stock movement, my second question is whether that movement is randomly distributed because of the pricing models or are the pricing models as they are because of the way price movements distribute? This is a “chicken or the egg” question that may not have an answer.
I will continue this discussion with my next post.
Categories: Option Trading | Comments (1) | PermalinkOption Volatility and Pricing (Part 1)
Posted by Mark on November 25, 2013 at 07:12 | Last modified: January 17, 2014 13:23The last post spawned a couple other thoughts that are each worth at least a few hundred words to discuss. Today I want to take a detour and complete what I was talking about with regard to the statistical bell curve.
This might be review for anyone who has studied options in the past.
When I posted the bell curve and did the math to calculate probabilities of future AAPL stock prices, a thought occurred to me: “what makes me think I can whip out a statistical bell curve and say options pricing has anything to do with it?” People who have studied stock investing may get price targets through fundamental analysis or sometimes through technical analysis (e.g. measured move) but when those prices will be realized is not emphasized too much. Option pricing actually affixes time to a range of potential stock prices and probability. How does that all work?
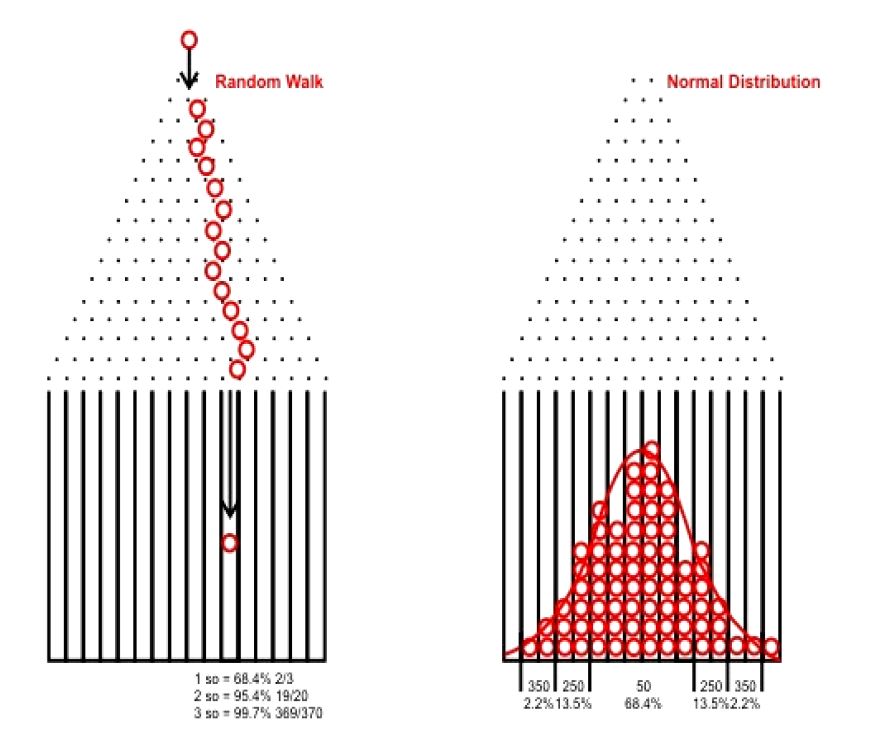
The answer is that most any option pricing model starts with Random Walk theory. Option pricing models involve probabilities that attempt to determine the chance an option will expire in the money based on a number of known parameters (e.g. put or call, time to expiration, implied volatility of the market, dividend yield, interest rates, strike price, stock price). Random Walk theory is well illustrated by the Plinko game of “Price is Right” fame:
The contestant up top can choose anywhere across the “PLINKO” lettering to drop her chip. Ultimately, she hopes for it to land in the middle at the bottom where she will win $10,000. When she drops the chip, it has a random chance of going to the right or left at each peg. If we do this many times then what does our distribution of coins at the bottom look like?
This website shows one such simulation:
I will continue this discussion in the next post.
Categories: Option Trading | Comments (1) | PermalinkCovered Calls and Cash Secured Puts (Part 12)
Posted by Mark on November 22, 2013 at 07:28 | Last modified: January 17, 2014 12:30I ended discussion in my last post with a suggestion that purchasing stock outright or trading the CC comes down to a matter of probabilities.
Purchasing the stock involves betting on a more improbable event to occur. Looking at the current option chain, suppose I purchase 100 shares of AAPL stock at $519.80 and sell a December (29) 530 call (20% implied volatility) for $7.40. The long stock will outperform the CC if AAPL rallies over $530 + $7.40 = $537.40 in 29 days. How likely is this to occur?
Let’s do some math based on the definition of implied volatility (IV):
1 standard deviation (SD) = Stock Price * IV * sqrt [ # days / 365]
1 SD = $519.80 * 0.20 * sqrt (29 / 365)
1 SD = $29.30
In this instance, AAPL must move $537.40 – $519.80 = $17.60 for the stock to outperform the CC.
# SD = $17.60 / $29.30 = 0.6 SD
How likely is this to occur?
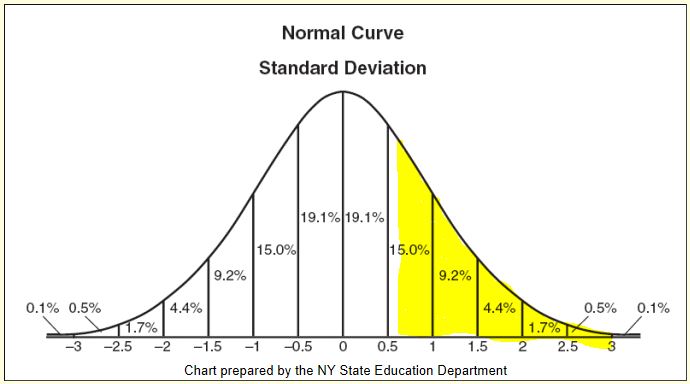
Looking at the graph I can see the chance of AAPL moving up at least 0.6 SD is under 30%.
If you are experienced with options then the rest of this post will be review.
To better understand this analysis, recall that it began with the option IV. IV describes how expensive an option is and how much the marketplace expects the stock to move over the next year (any time interval may be calculated by manipulating the equation). If traders believe an option is cheap then they will buy it and option price will increase. If traders believe an option is expensive then they will sell it and option price will decrease. People might think an option is cheap (expensive) if they expect the stock to move more (less) than IV suggests.
AAPL is among the most liquid of option markets and the more liquid the market, the more people (trading capital) are predicting the move. If you think you know more than the hundreds of millions of dollars (at least!) predicting the market, which include money managers, fund managers, professional advisors, analysts, big firms, etc., then just be careful.
I will continue this discussion in the next post.
Categories: Option Trading | Comments (1) | PermalinkCovered Calls and Cash Secured Puts (Part 11)
Posted by Mark on November 19, 2013 at 06:52 | Last modified: January 16, 2014 10:05In my last post, I showed graphical comparison of CCs ($BXM) and outright stock (S&P 500 index) over three different time intervals. One reason I believe more investors do not implement CCs is because they underperform in strongly bullish market environments.
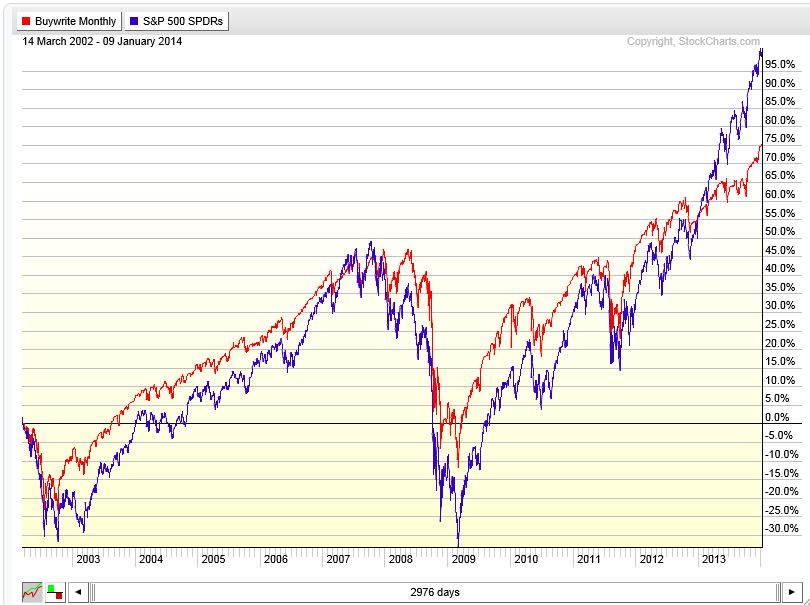
To better understand this, I need look no further than the third graph from my last post:
Since mid-2012, S&P 500 (blue) is clearly outperforming $BXM (red). This happens in strong bull markets because shareholder profit goes parabolic (seemingly unlimited) along with the stock. In contrast, CC/CSP traders capture a maximal profit on every trade.
Human nature is to be dissatisfied when others are winning even if I am profiting, too. This is an emotional response.
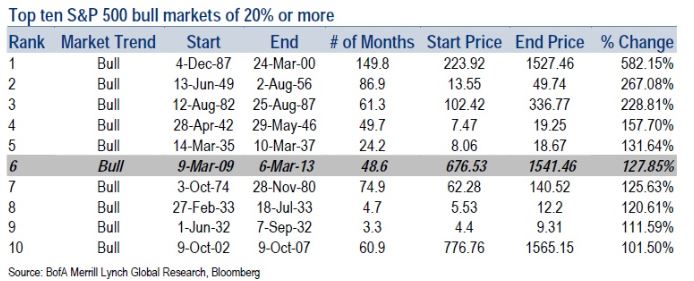
Emotions are sometimes illogical and I believe this is such an instance. What we are currently experiencing is a bull market of historic proportions. Barry Ritholtz lists the strongest bull markets since 1929 in this article:
Extrapolating from these data, the current bull market is up 164.27%, which ranks this as the fourth strongest bull market since 1929. This is a very unlikely occurrence! Is it logical to be dissatisfied when losing to a stroke of luck?
The nature of any game is that unlikely things sometimes happen. People do occasionally hit the jackpot on slot machines. Although few and far between, people do win the lottery. People do root for the underdog because the underdog does sometimes win. These are examples of good luck. Long stock investors taking credit for luck falling their way hints at the “fooled by randomness” argument, which is beyond the scope of today’s writing.
For now, I will summarize by saying one reason more investors don’t trade CC/CSPs is probably because of the potential to underperform when the masses seem to be celebrating. Those who do trade CC/CSPs in a raging bull market environment like this may be tempted to become “fully invested,” which can mean closing the short option and holding long stock outright.
I will continue this discussion in the next post.
Categories: Option Trading | Comments (1) | PermalinkCovered Calls and Cash Secured Puts (Part 10)
Posted by Mark on November 14, 2013 at 07:05 | Last modified: January 15, 2014 08:51In the last post, I discussed volatility of returns. This is a measure of risk and the lower the volatility, the larger a position size I can feel comfortable trading. This seems to be the biggest benefit to trading CCs and CSPs especially when comparisons are done over different time intervals.
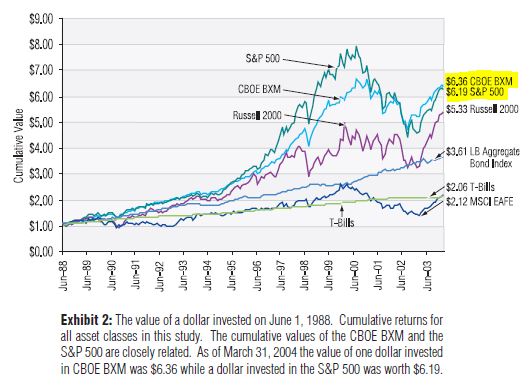
Taken from the Ibbotson study mentioned in my last post, the following graph shows performance between 1985 and 2003:
Here, $BXM (CCs on S&P 500) matches S&P 500 as measured by absolute returns and outperforms with regard to volatility. Volatility is harder to see on the graph but notice where the index goes way up in 2000 and then bottoms in 2002, $BXM didn’t go as far up and bottomed in the same place. This is lower volatility.
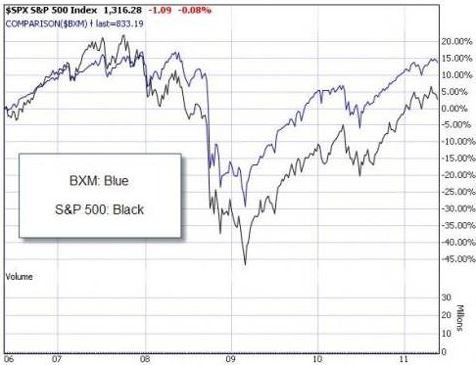
Below is a shorter time interval from 2006 to 2011:
Here, $BXM outperforms S&P 500 in terms of absolute returns and volatility. Once again, volatility is harder to see but notice how $BXM was lower than the index in 2007 and dropped less to its bottom in 2009. This is lower volatility.
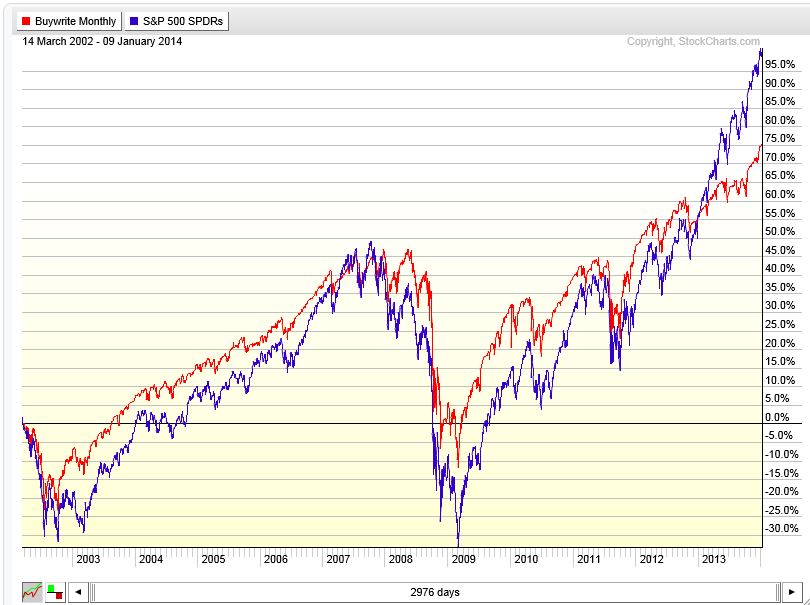
Finally, the following graph from 2002 to recent times shows something different:
Here, $BXM outperforms with regard to volatility and underperforms as measured by total return. From a similar level in 2007, $BXM dropped less through 2009 and then rallied less through 2013 as the market reached all-time highs. This is lower volatility. Investors cheer the greater S&P volatility in this case because it is upside volatility.
While investors like upside volatility and despise downside volatility, we really don’t get to choose. Times like the present make it feel like we get to choose and like we are making the right investing choices but this is the “fooled by randomness” argument that I can take up in a future post.
Today’s post shows three different time intervals for comparison between S&P 500 and $BXM. While CCs tend to post equal to lower returns during bullish market environments, they display a lower volatility of returns in all market environments.
Categories: Option Trading | Comments (2) | PermalinkCovered Calls and Cash Secured Puts (Part 9)
Posted by Mark on November 11, 2013 at 06:14 | Last modified: January 14, 2014 07:35Earlier in this blog series I posted a risk graph showing why CCs and CSPs are less risky than stock. In the last post, I reviewed backtesting results showing index CC returns ($BXM) to be roughly equivalent to the index itself with only 67% of the volatility. This affirms my former illustration and can mean better returns for traders.
I will use downside volatility to explain why this is the case. Volatility of returns is always something to monitor when understanding performance of a trading system. Volatility is measured by standard deviation to determine how much returns deviate from their average. Returns may deviate to the upside or downside but downside volatility is what makes me uncomfortable as a trader. The more I lose, the more stress and discomfort I will experience. If this becomes extreme then I will stop trading the system even if it means exiting at the worst time. At least I can then begin to accept the magnitude of loss and not have to worry about future losses becoming even larger.
Lower standard deviation of returns means the system may be traded in larger size. Suppose my loss tolerance is 20% of the total account. For the sake of simplicity, I will say the S&P 500 lost 50% in the 2008-2009 financial crisis. I therefore would not have wanted to invest more than 40% of my account in the S&P because the resultant loss would be 20% total. Because the $BXM exhibits roughly 67% of the S&P volatility, the $BXM may have only lost 33.5% during the financial crisis. I could therefore have invested 60% of my account in $BXM while remaining within tolerance limits.
Being able to invest more of my account equates to larger returns. An 11.7% per year return equates to 4.68% on the whole account when investing 40% and 7.00% on the whole account when investing 60%. These differences compound over time. Over 25 years, $1 million becomes $3.138M in the S&P 500’s case vs. $5.427M in the $BXM’s case.
Categories: Money Management, Option Trading | Comments (2) | PermalinkCovered Calls and Cash Secured Puts (Part 8)
Posted by Mark on November 8, 2013 at 05:50 | Last modified: January 14, 2014 06:26Aside from being less risky than stock, the $BXM is another reason I am biased to believe in CCs and CSPs.
When the stock market is in a bullish phase, success trading CCs and CSPs is reported a thousand different ways by investment newsletters, services, and retail traders seen in forums and mailing lists over the Internet. While everyone has their own particular way of doing this, I want to know how it all shakes out on average. Is there any true Edge?
The Chicago Board Options Exchange along with Standard & Poor’s created a benchmark index that tracks performance of a hypothetical CC strategy on the S&P 500 index. Known as the $BXM, this index was created in 2002. The index is designed as follows:
- Hypothetically purchase the S&P 500 index [e.g. using spot SPX price]
- Sell a one-month slightly out-of-the-money (OTM) [SPX] option
- Hold until expiration Friday and then cash-settled
- Sell a new one-month slightly OTM call
In 2004, Ibbotson Associates performed a 16-year backtest on $BXM. The backtest ran from June 1, 1988, through March 31, 2004. The compound annual return of the $BXM was 12.39% vs. 12.20% for the S&P 500. Volatility of the $BXM was only about two-thirds that of the S&P 500, though. This makes for higher risk-adjusted performance: 0.22 vs. 0.16 (Stutzer index) in favor of the $BXM.
In 2006, Callan Associates performed an 18-year backtest on $BXM to extend the research done by Ibbotson. The backtest ran from June 1, 1988, through August 31, 2006. The compound annual return of the $BXM was 11.77% vs. 11.67% for the S&P 500. Again, volatility of the $BXM was only about two-thirds that of the S&P 500, which again makes for higher risk-adjusted performance: 0.20 vs. 0.15 (Stutzer index).
Both studies noted $BXM outperformance in down markets and underperformance in bull markets due to limited upside profit potential.
I will continue this discussion in my next post.
Categories: Option Trading | Comments (0) | PermalinkCovered Calls and Cash Secured Puts (Part 7)
Posted by Mark on November 5, 2013 at 07:04 | Last modified: January 14, 2014 05:35In my last post, I discussed conflicts of interest that potentially compromise the credibility of commentators cited in part 5 of this blog series.
The general conflict of interest principle suggests that whether or not those commentators believe option trading to be a worthwhile pursuit, they stand to profit by representing it that way. Regardless of whether you, as a trader, make or lose money, they can profit by getting you to take interest, buy books, subscribe to services, and/or trade options. More likely than not, the commentators do believe the positivity they spread because in the future there is potential profit to be had through “word of mouth.” In other words, if they represent option trading positively and if I have success with it, then I may speak highly of the commentators to other people, which can generate additional referrals for them.
Whether the additional referrals occur, however, the commentators’ consistent positivity will generate some immediate revenue. This alone makes it worthwhile for them.
If the commentators are sociopathic in nature then their external positivity toward the subject matter will be offset by internal skepticism. This is often hard, if not impossible, for the critical thinker to judge.
Conflict of interest is always something to be on the lookout for in any discipline, field of inquiry, or business transaction. In some cases it is blatant and egregious and in other cases it’s a moot point. Does the last post deserve membership in my optionScam.com category? Probably not because as discussed in part 3, CC/CSPs are less risky than outright stock ownership. A great many people are willing to own stock. At least as many people should be willing to trade CC/CSPs.
Another reason I am biased in favor of CC/CSPs is because of $BXM, which I will discuss in my next post.
Categories: Option Trading | Comments (0) | Permalink