Weekly Iron Butterfly Backtest (Part 28)
Posted by Mark on August 22, 2013 at 07:46 | Last modified: December 6, 2013 14:36Over the last two months, I have been backtesting the weekly option trade described here. I studied 26 weeks of the trade from January 6, 2011, through July 7, 2011. The trade won 14 times and lost 12. The winning trades averaged $441.64 while the losing trades averaged -$912.50. The profit factor was a dismal 0.57: low enough to make minced meat out of any size trading account.
Blame the trade or blame the backtest?
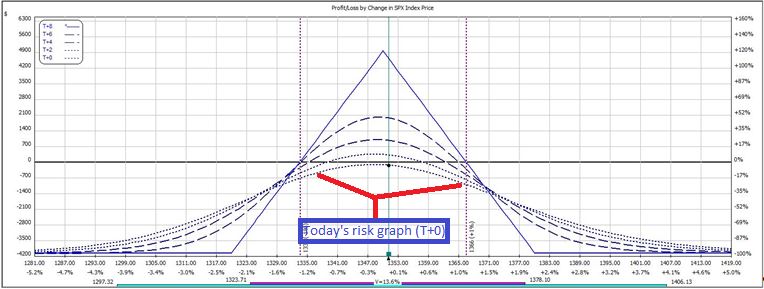
Because this is a negative gamma trade, I suspect the backtesting methodology exaggerates the losses. Negative gamma refers to the “frownie face” (upside down parabola) shape of today’s risk graph:
To the upside, negative gamma makes net position delta (slope of T+0 curve) more negative. To the downside, negative gamma makes net position delta more positive. I lose money either way.
The biggest detriment of these moves may occur near adjustment points. In these areas, net position delta is relatively large. Due to the observation above, I would hypothesize the trade to lose more from an X-point market rally (decline) beyond the upper (lower) adjustment point than the trade would gain from an X-point market decline (rally) from the upper (lower) adjustment point. In live trading, I can monitor the trade and make adjustments in a timely fashion. In backtesting, though, I only had 30-minute intervals of data and I had to settle for available prices regardless of how far beyond the adjustment points the underlying may have moved.
I suspect the error (difference between market price at 30-minute intervals and the actual adjustment point) hurts me more than it helps me.
The only way to assess how accurate these backtesting results might be is to trade the iron butterfly in small size. Seeing how dismal those backtesting results were, though, I’d rather keep the cash and take it to Vegas.
Show me a backtest that performs well in the face of minor tweaks biased against it and you’ll have a trade that I would be willing to place with real money.

Comments (4)
Such dismal results are actually a success; you could simply switch from a credit fly to a debit fly and reap that theoretical loss to the traders selling you the fly as a profit to you.
Hi Mark,
A credit fly and debit fly are synthetically equivalent. The only difference will be execution. In other words, this is not a trade where the seller of one is a buyer of the other.
On the other hand, if you were suggesting doing a weekly reverse butterfly then I doubt that would work either. It would be akin to buying cheaper weekly straddles.
Thanks for the comment!
A reverse iron butterfly and a straddle have similarities, but they are not equivalent: the credit received for the wings can be the difference between a profit or a loss. The fact that a weekly iron butterfly is a dismal loser is, in effect, proof that its opposite is a winner. I believe that its profit factor can be further enhanced by setting a +/- target for the underlying and, if the targets are not reached, to exit the trade friday morning, whether at a profit/loss to limit the maximum loss.
I agree with your first sentence.
I disagree with your second sentence. This is not a zero-sum game because of transaction costs.
I think this would make for an interesting backtest but it would be quite lengthy both to get a large enough sample size for validity and to allow a sufficient scan of the surrounding parameter space. Your latter condition would further increase the complexity.