Weekly Iron Butterfly Backtest (Part 28)
Posted by Mark on August 22, 2013 at 07:46 | Last modified: December 6, 2013 14:36Over the last two months, I have been backtesting the weekly option trade described here. I studied 26 weeks of the trade from January 6, 2011, through July 7, 2011. The trade won 14 times and lost 12. The winning trades averaged $441.64 while the losing trades averaged -$912.50. The profit factor was a dismal 0.57: low enough to make minced meat out of any size trading account.
Blame the trade or blame the backtest?
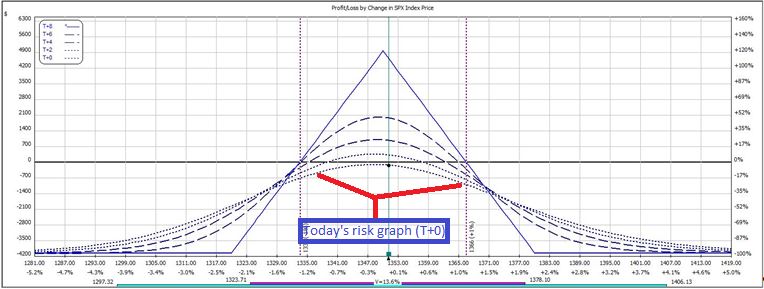
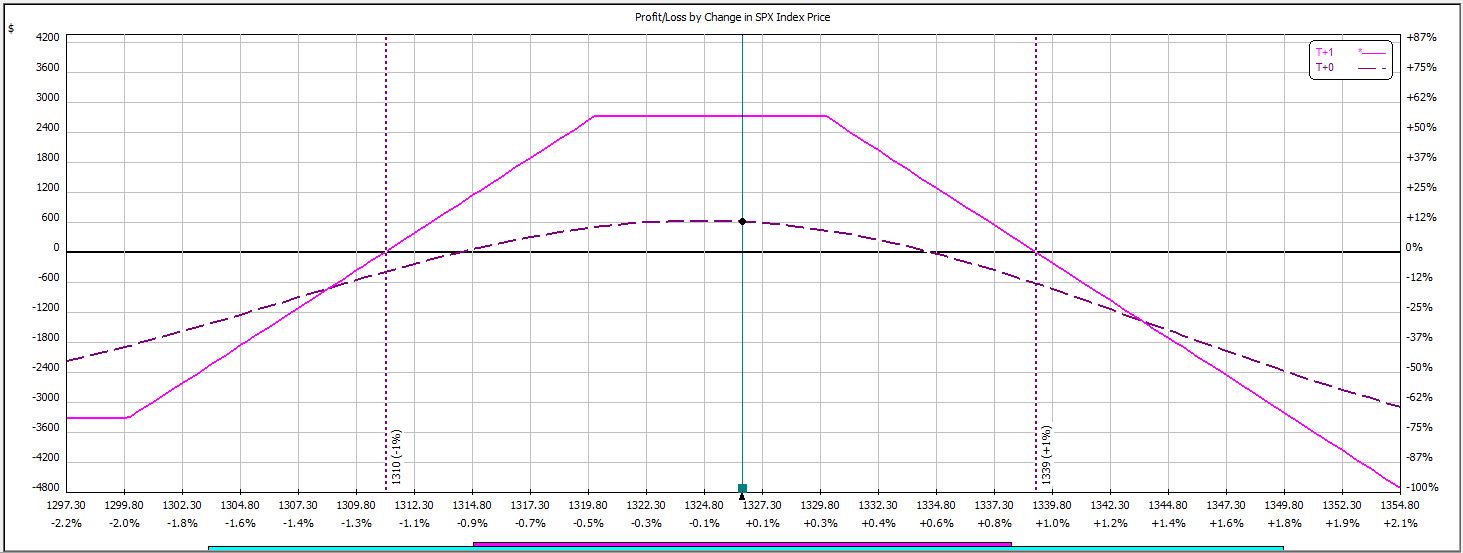
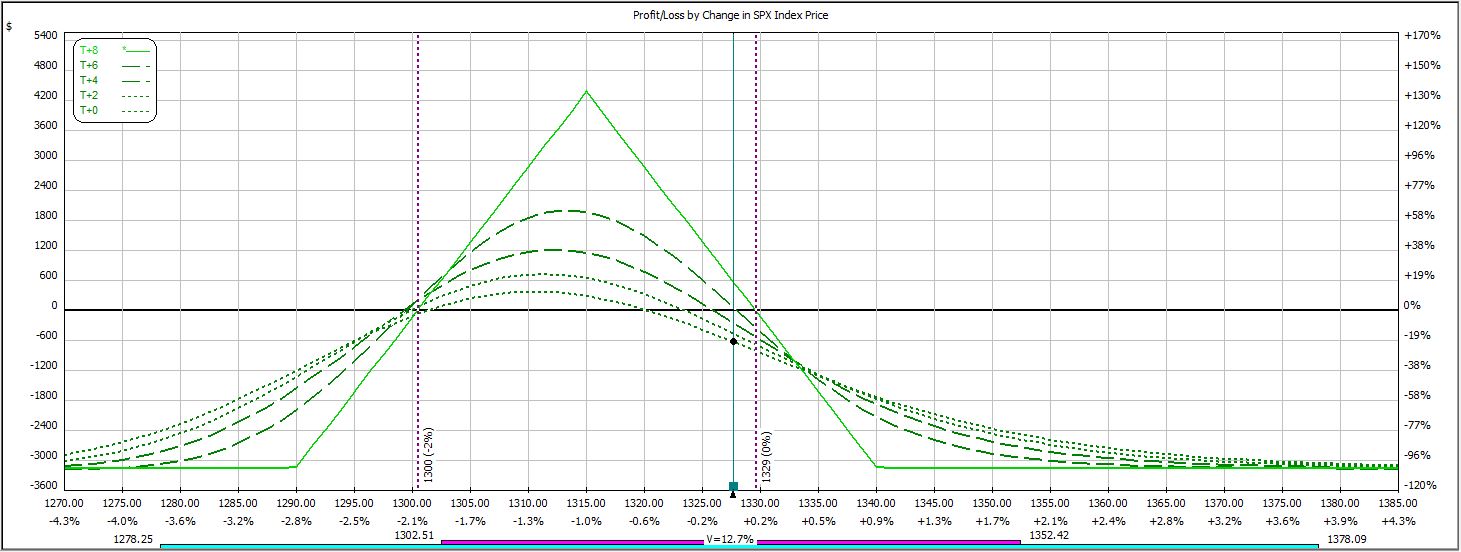
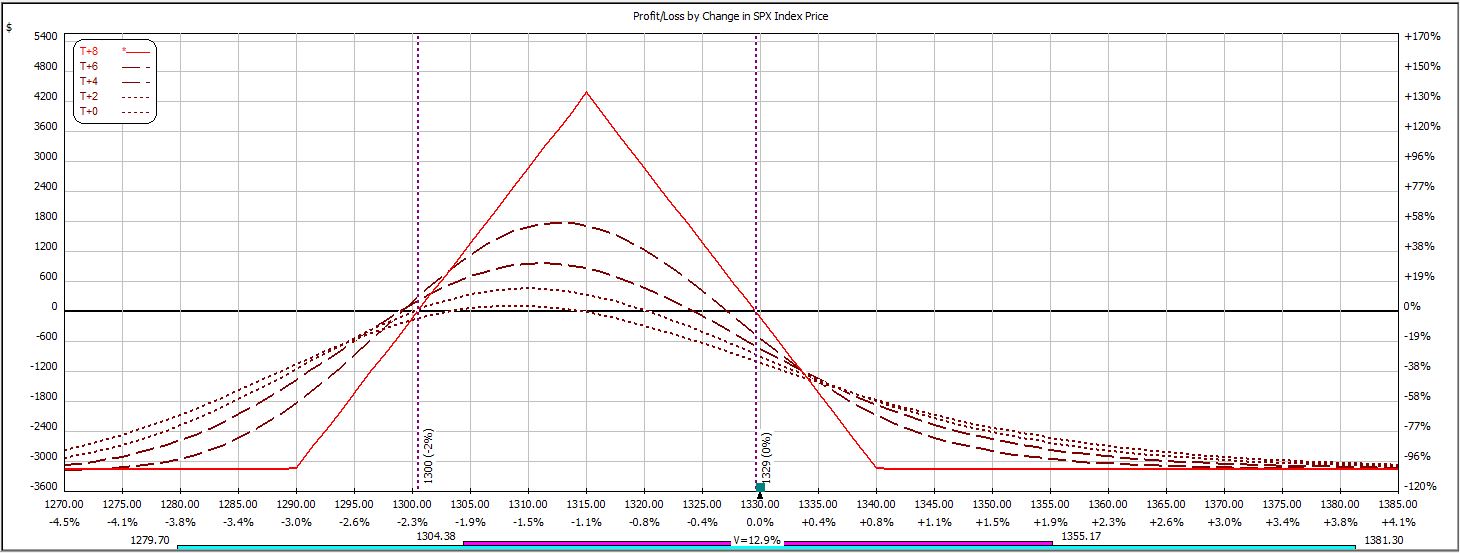
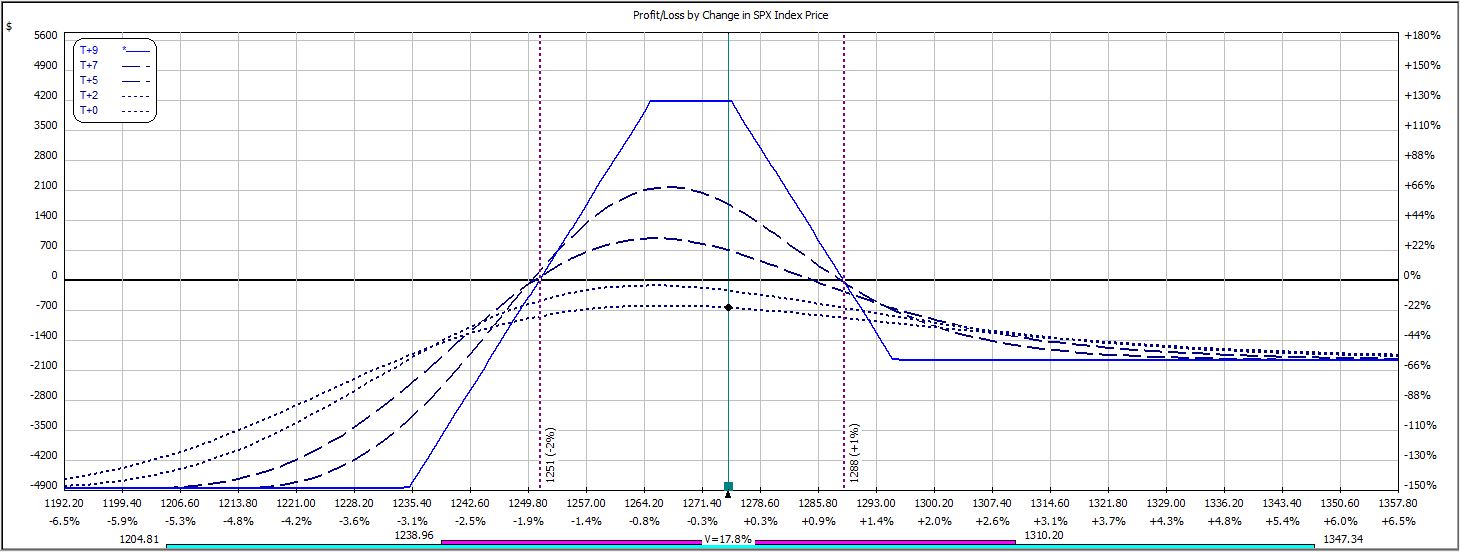
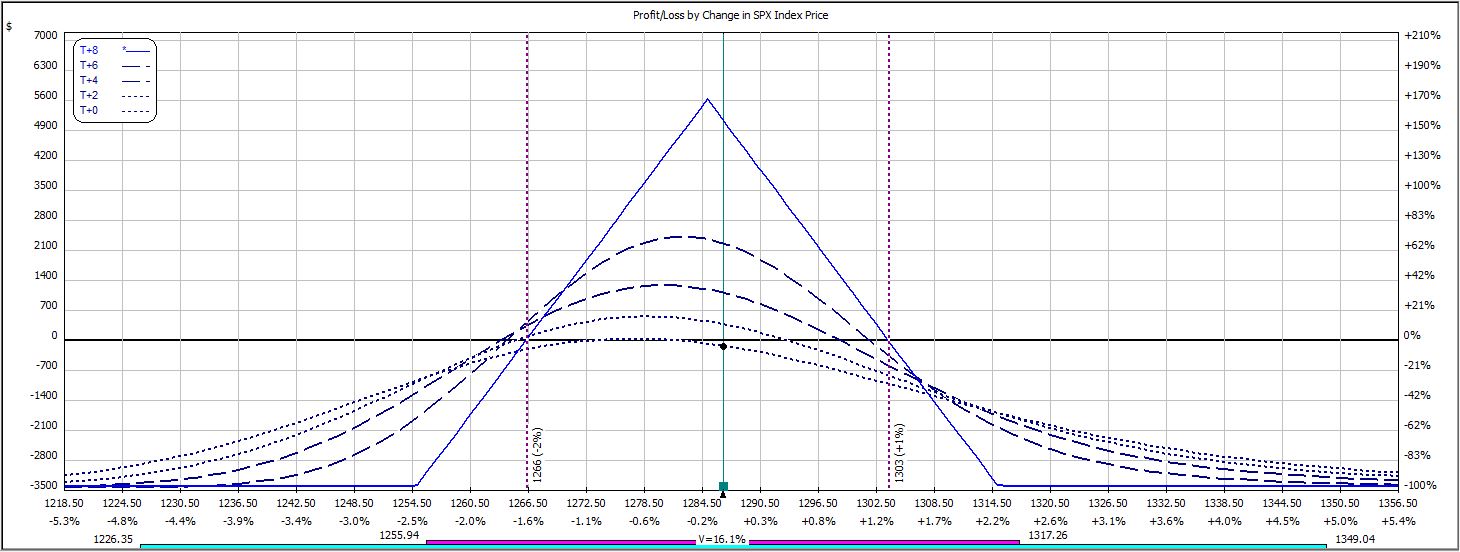
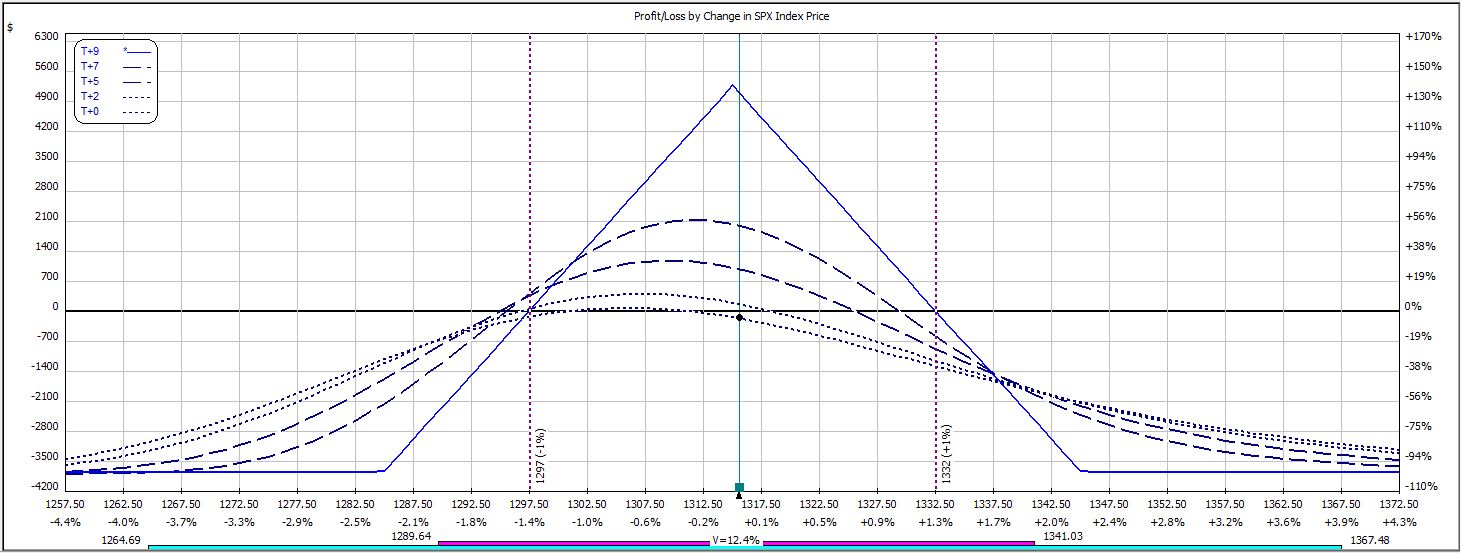
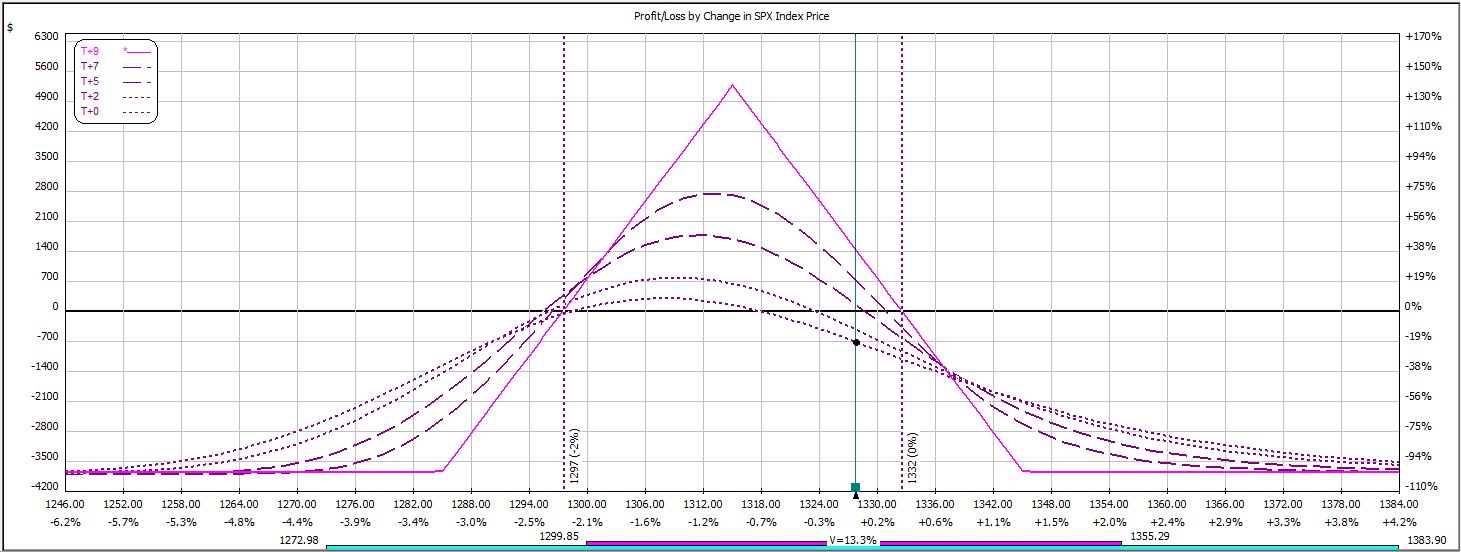
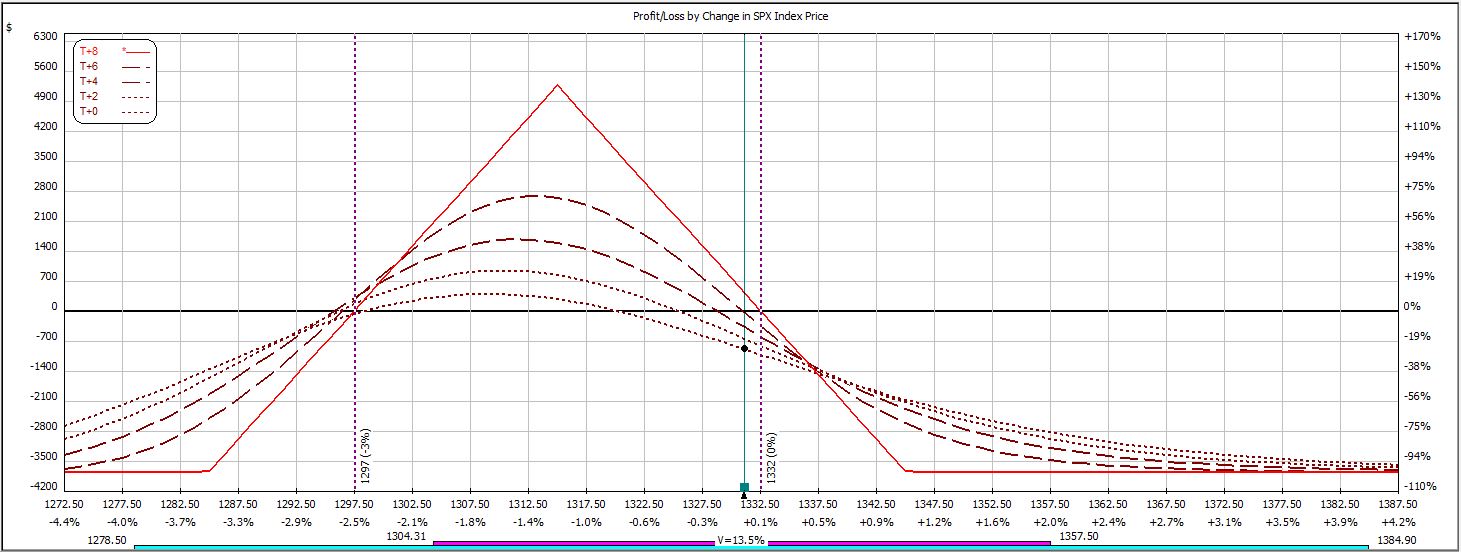
Because this is a negative gamma trade, I suspect the backtesting methodology exaggerates the losses. Negative gamma refers to the “frownie face” (upside down parabola) shape of today’s risk graph:
To the upside, negative gamma makes net position delta (slope of T+0 curve) more negative. To the downside, negative gamma makes net position delta more positive. I lose money either way.
The biggest detriment of these moves may occur near adjustment points. In these areas, net position delta is relatively large. Due to the observation above, I would hypothesize the trade to lose more from an X-point market rally (decline) beyond the upper (lower) adjustment point than the trade would gain from an X-point market decline (rally) from the upper (lower) adjustment point. In live trading, I can monitor the trade and make adjustments in a timely fashion. In backtesting, though, I only had 30-minute intervals of data and I had to settle for available prices regardless of how far beyond the adjustment points the underlying may have moved.
I suspect the error (difference between market price at 30-minute intervals and the actual adjustment point) hurts me more than it helps me.
The only way to assess how accurate these backtesting results might be is to trade the iron butterfly in small size. Seeing how dismal those backtesting results were, though, I’d rather keep the cash and take it to Vegas.
Show me a backtest that performs well in the face of minor tweaks biased against it and you’ll have a trade that I would be willing to place with real money.
Categories: Backtesting | Comments (4) | PermalinkWeekly Iron Butterfly Backtest (Part 27)
Posted by Mark on August 19, 2013 at 07:13 | Last modified: December 5, 2013 12:36In this blog series, I’m backtesting the weekly option trade described here.
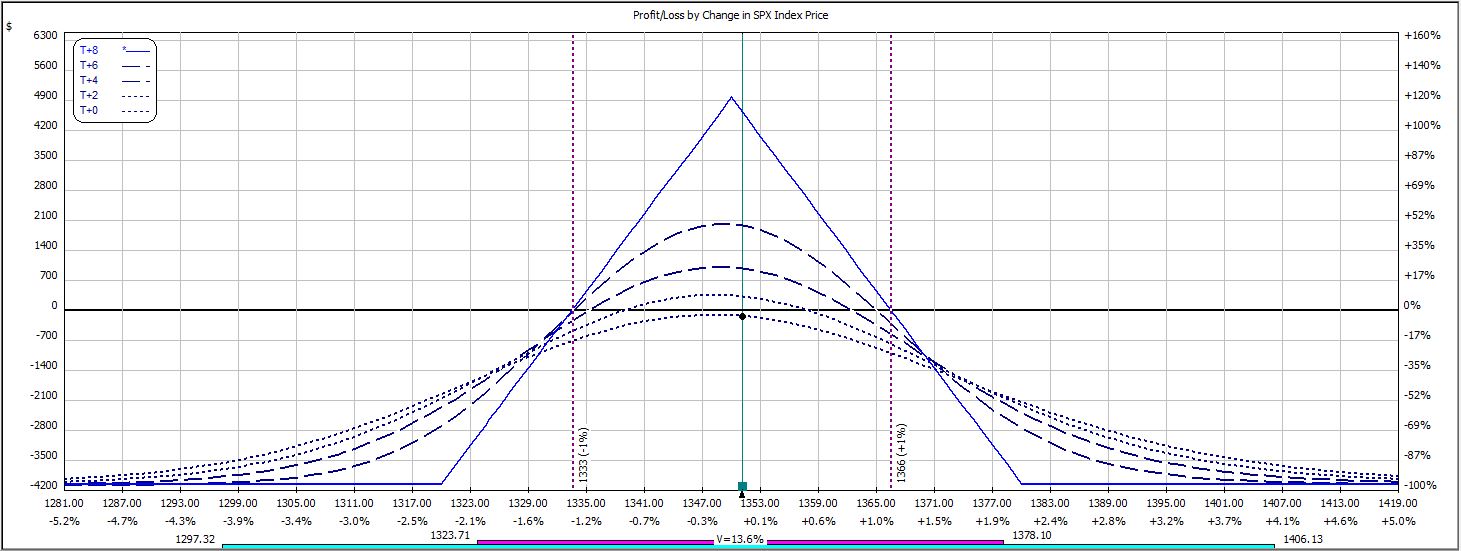
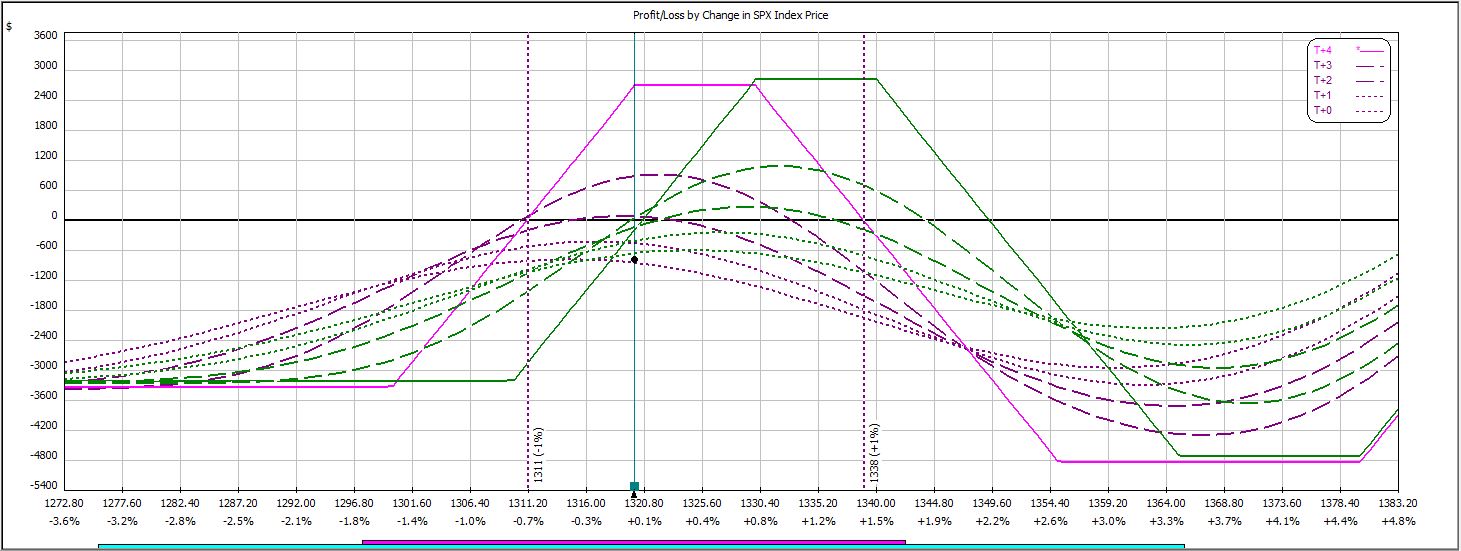
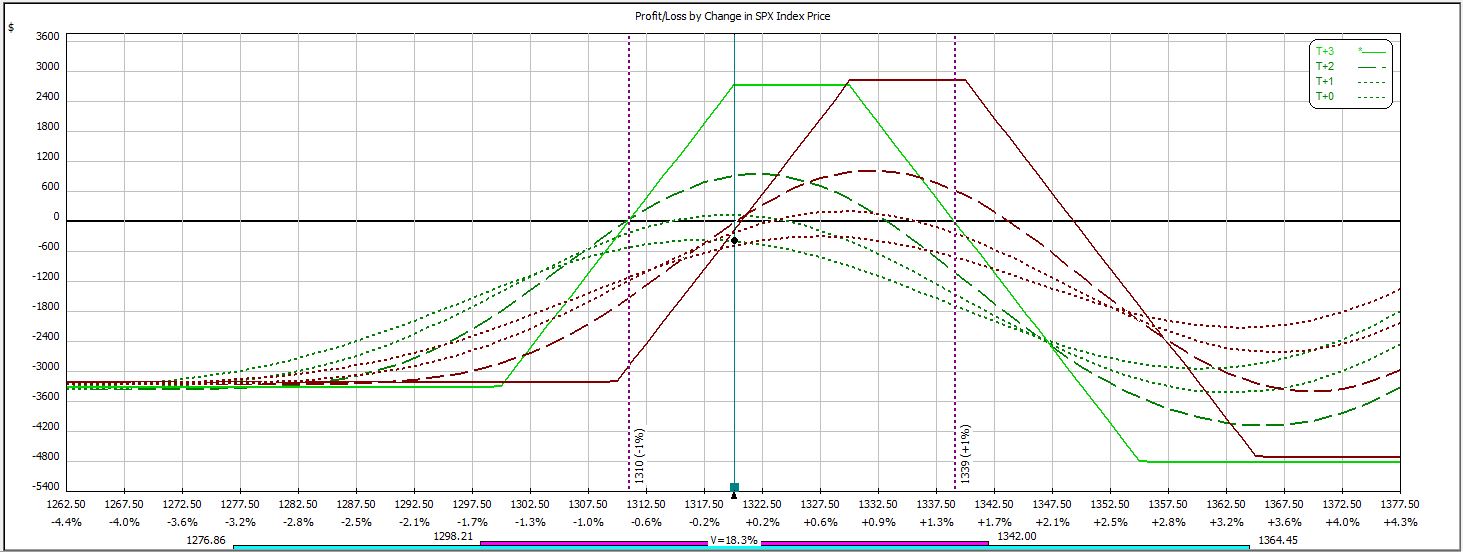
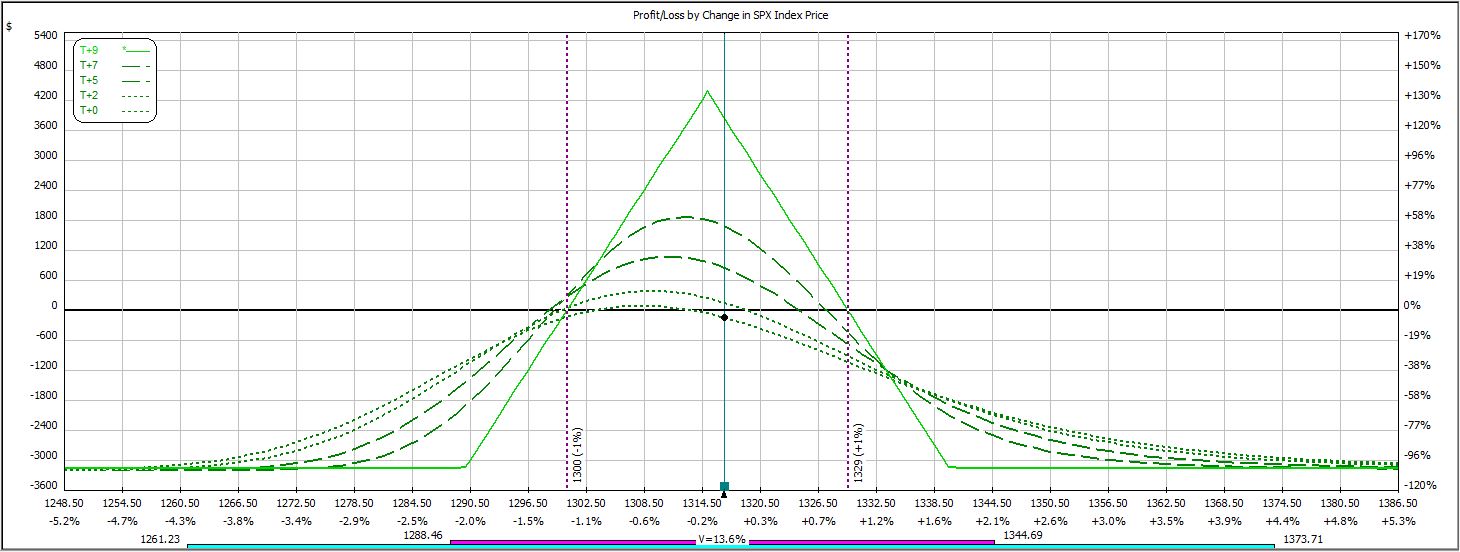
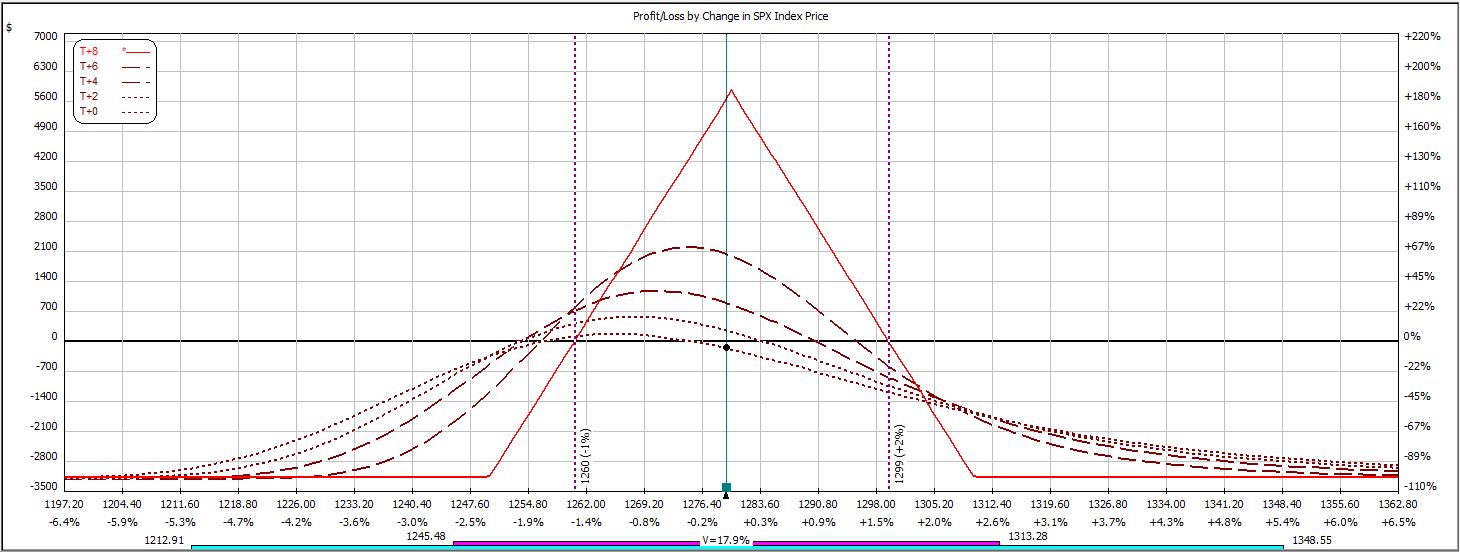
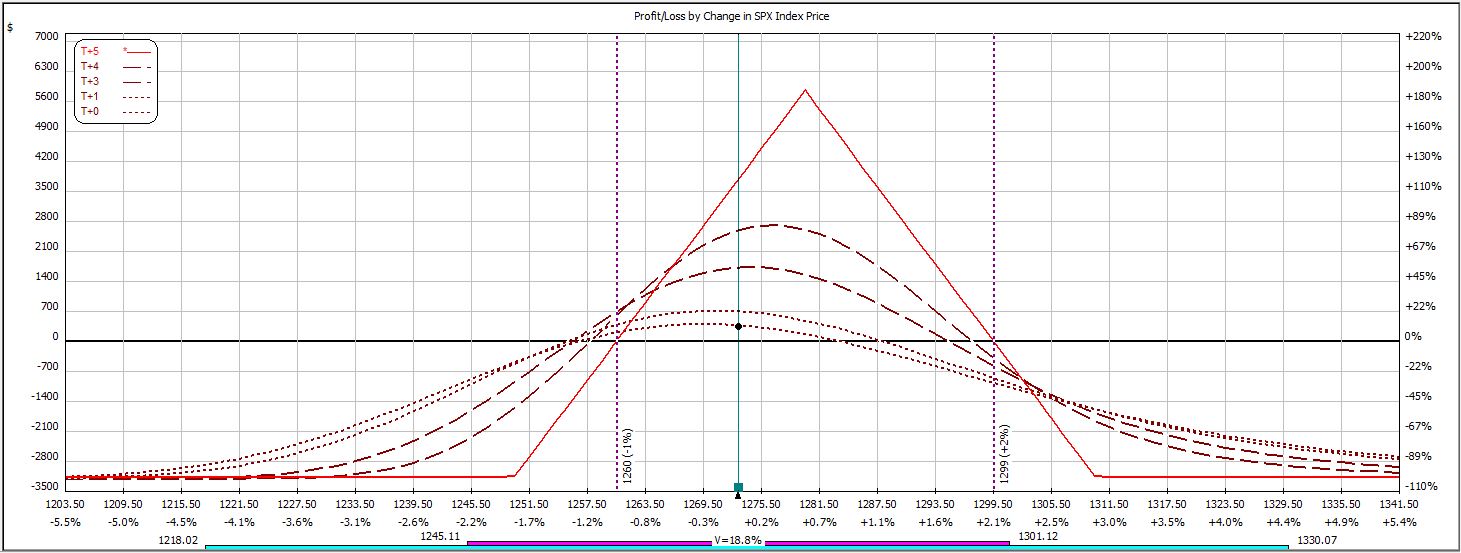
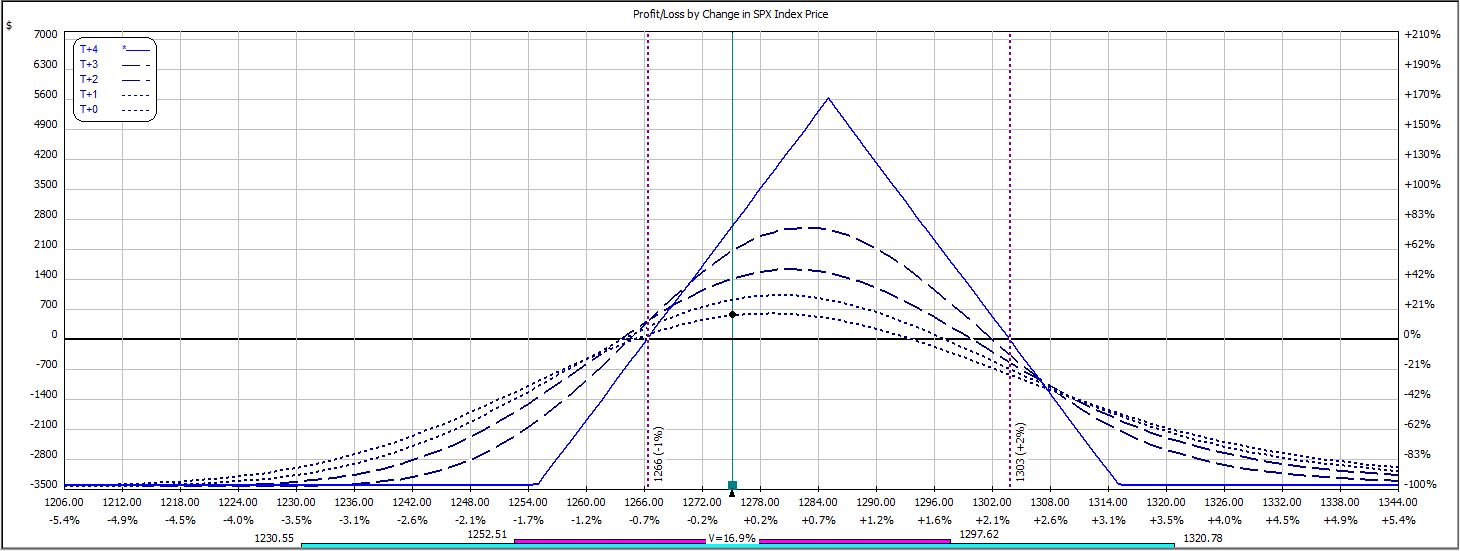
Week 26′s trade begins with this:
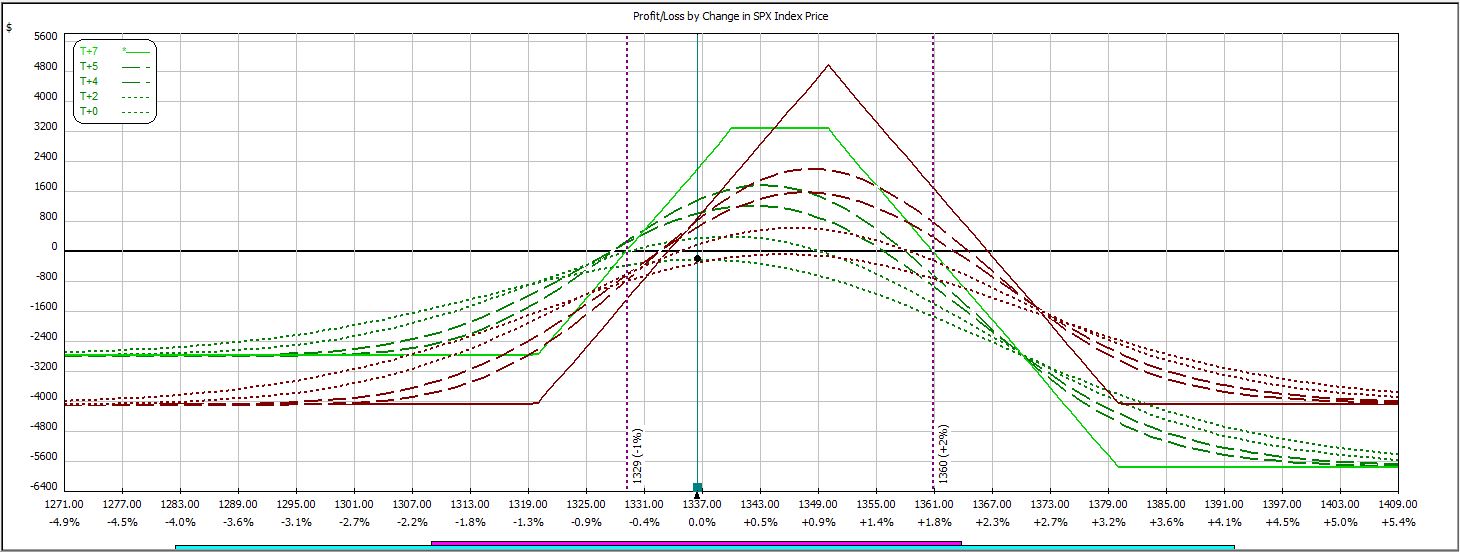
After threatening the upside, the market reversed and hit a downside adjustment point:
After the weekend, the market continued to move lower and hit a second adjustment point:
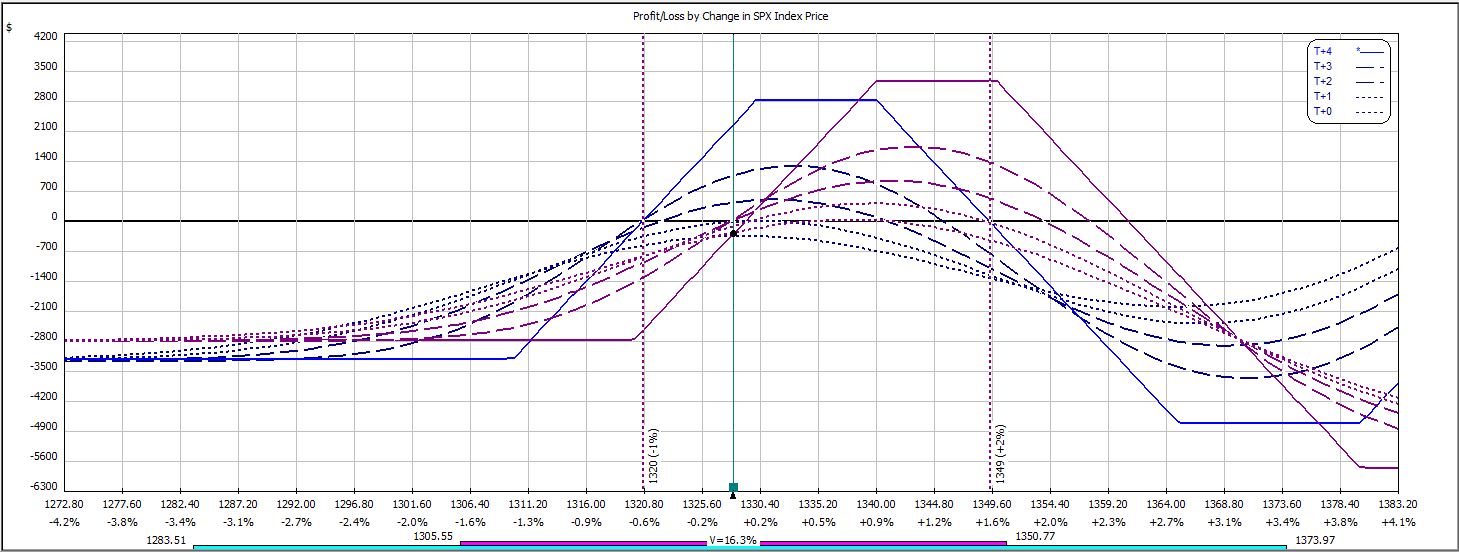
The market continued moving lower that day and hit a third adjustment point:
Due to transaction costs, this adjustment would have taken the trade from a loss of $777 to $921, which is max loss. I therefore did not make the adjustment.
The trade survived into the next day where the market continued to hang out below the third adjustment point. Having collected an additional day of time decay now, I could afford to make the adjustment without hitting max loss:
The market traded in a range into expiration Thursday when the profit target was realized:
P/L on Day 1 ranged from +$90 to -$498.
P/L on Day 2 ranged from +$27 to -$287 on an adjusted margin requirement of $5,769.
P/L on Day 5 (nothing happened over the weekend) ranged from -$435 to -$777 on an adjusted margin requirement of $4,719.
P/L on Day 6 ranged from -$291 to -$633 on an adjusted margin requirement of $4,812.
P/L on Day 7 ranged from +$345 to -$264.
The trade was closed on Day 8 for a profit of $588, which is a return of 10.2% on max margin.
This trade has now won in 14 out of 26 weeks.
Categories: Backtesting | Comments (0) | PermalinkWeekly Iron Butterfly Backtest (Part 26)
Posted by Mark on August 16, 2013 at 07:51 | Last modified: December 5, 2013 12:33In this blog series, I’m backtesting the weekly option trade described here.
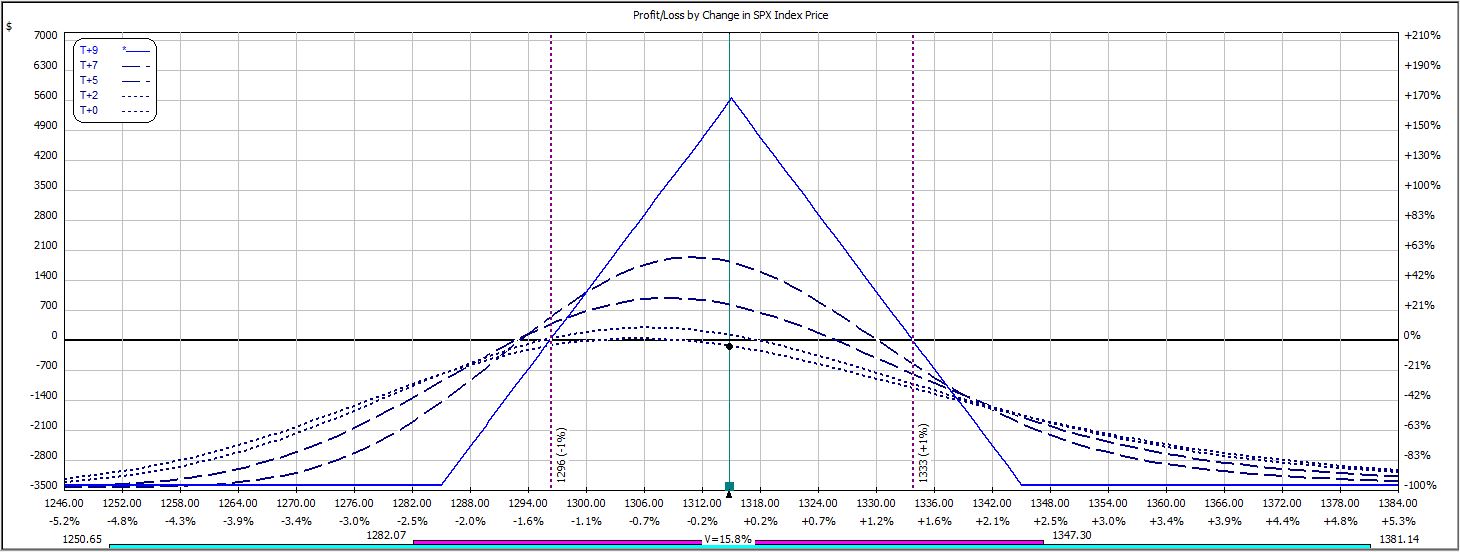
Week 25′s trade begins with this:
The market rallied into Friday and hit an adjustment point:
Unfortunately, the trade was already down $621. Slippage on the adjustment alone would push this trade beyond the max loss of $631. Exiting the trade prematurely would insert an additional parameter into this trading system (i.e. how many dollars under max loss does the P/L need to be to allow for adjustment). Since more parameters requires more detailed backtesting to avoid curve-fitting, I opted to hold on.
Max loss was realized soon after:
This trade lost $1,035, which is 32.8% on $3,159 margin. The market rallied 13 points–about 1%–in one day to knock this trade out.
The trade is now 13-12 in 25 weeks.
Categories: Backtesting | Comments (0) | PermalinkWeekly Iron Butterfly Backtest (Part 25)
Posted by Mark on August 14, 2013 at 05:54 | Last modified: September 10, 2013 10:49In this blog series, I’m backtesting the weekly option trade described here.
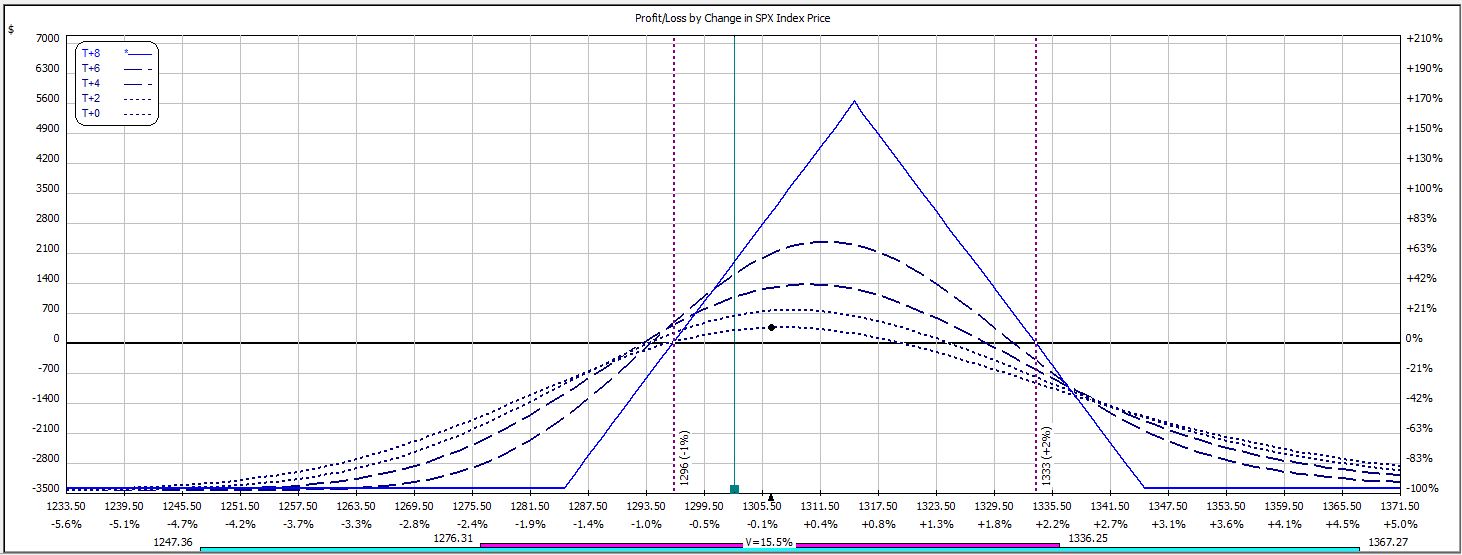
Week 24′s trade begins with this:
The market rallied in the afternoon to an adjustment point:
Soon after, the trade hit max loss of 12.9% on max margin of $4,857:
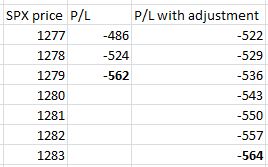
The trade was down $486 before the adjustment and $522 afterward. While slippage is a reality of trading, perhaps I should not have adjusted with max loss being $560? The adjustment did cut net position delta from -38 to -7. Taking into account delta only (gamma was slightly higher in the non-adjustment case), the following table shows projected P/L with and without adjustment:
Basically this trade is damned if I do and damned if I don’t. Adjustment gave the trade farther to run before hitting max loss, which was hit anyway.
The trade is now 13-11 in 24 weeks.
Categories: Backtesting | Comments (0) | PermalinkWeekly Iron Butterfly Backtest (Part 24)
Posted by Mark on August 12, 2013 at 06:27 | Last modified: August 28, 2013 10:30In this blog series, I’m backtesting the weekly option trade described here.
Thursday’s data was missing from the software so week 23′s trade begins with this on Friday:
The profit target was hit early Monday morning:
P/L ranged from -$153 to +$144 on Day 1.
On Day 4 (nothing happened over the weekend), the trade closed for a profit of $339 on $3,174 margin, which is 10.7%.
The trade is now 13-10 in 23 weeks but the profit factor remains dismal at 0.60.
Categories: Backtesting | Comments (0) | PermalinkWeekly Iron Butterfly Backtest (Part 23)
Posted by Mark on August 9, 2013 at 06:34 | Last modified: August 28, 2013 10:30In this blog series, I’m backtesting the weekly option trade described here.
Week 22′s trade begins with this:
After threatening the upside adjustment point, the market dropped past the downside adjustment point the very next day. No adjustment was made with the trade in profit.
Early Monday morning, the profit target was hit:
P/L ranged from -$144 to -$351 on Day 1.
P/L ranged from +288 to +$24 on Day 2.
The trade was closed on Day 5 (nothing happened over the weekend) for a profit of $579 on $3,405, which is 17.0%.
The trade has now won on back-to-back weeks improving its win-loss record to 12-10.
Categories: Backtesting | Comments (0) | PermalinkWeekly Iron Butterfly Backtest (Part 22)
Posted by Mark on August 7, 2013 at 08:06 | Last modified: August 27, 2013 10:22In this blog series, I’m backtesting the weekly option trade described here.
Week 21′s trade begins with this:
A downside adjustment point was hit early the next day but with the trade up money, no adjustment was made.
A couple hours later, the profit target was reached:
P/L ranged from -$36 to -$240 on Day 1.
P/L ranged from +$25 to +$369 on Day 2, which is where the trade was closed for a gain of 10.9% on $3,393 margin.
This trade is now 11-10 in 21 weeks.
Categories: Backtesting | Comments (0) | PermalinkWeekly Iron Butterfly Backtest (Part 21)
Posted by Mark on August 5, 2013 at 06:40 | Last modified: August 25, 2013 12:45In this blog series, I’m backtesting the weekly option trade described here.
Week 20′s trade begins with this:
The market rallied on Day 1 to an adjustment point. The adjustment could not be made, however, because slippage alone would put the trade at max loss:
Max loss was hit early on Day 2:
P/L ranged from -$714 to -$144 on Day 1.
The trade was closed on Day 2 for a loss of $867 on $3,759 margin, which is -23.1%.
In 20 weeks, the trade has now won 10 times.
Categories: Backtesting | Comments (0) | Permalink