Weekly Iron Butterfly Backtest (Part 18)
Posted by Mark on July 29, 2013 at 07:50 | Last modified: August 8, 2013 09:06In this blog series, I’m backtesting the weekly option trade described here.
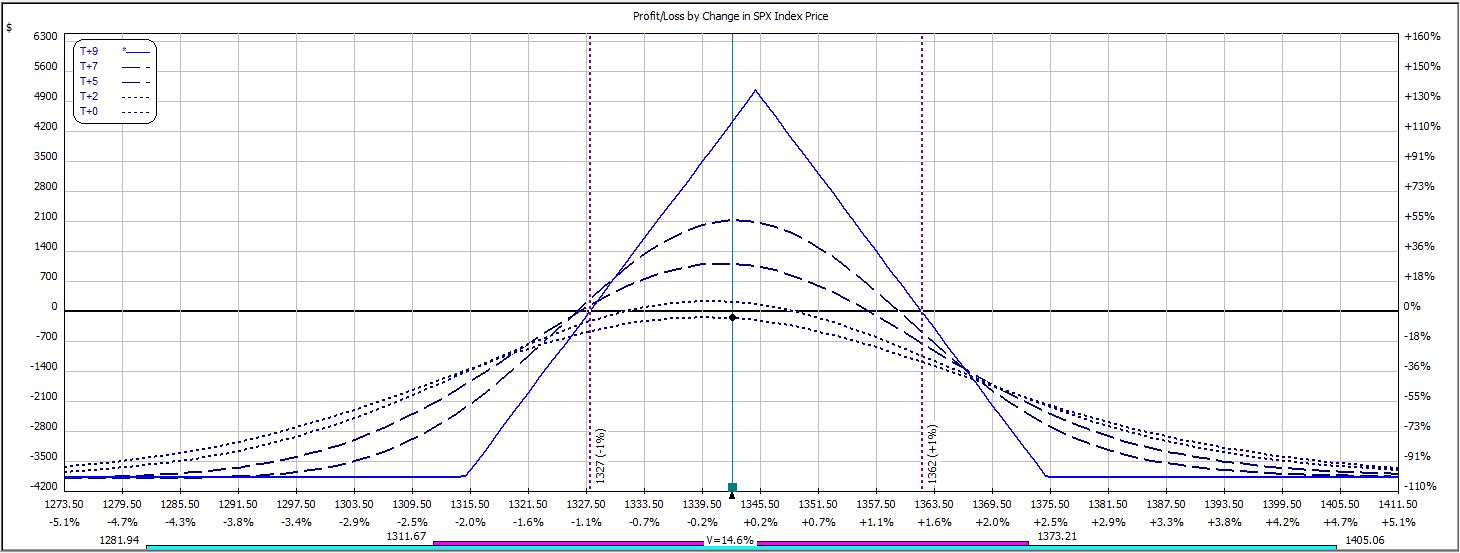
Week 17’s trade is the second consecutive classic example of a whipsaw. The trade starts with this:
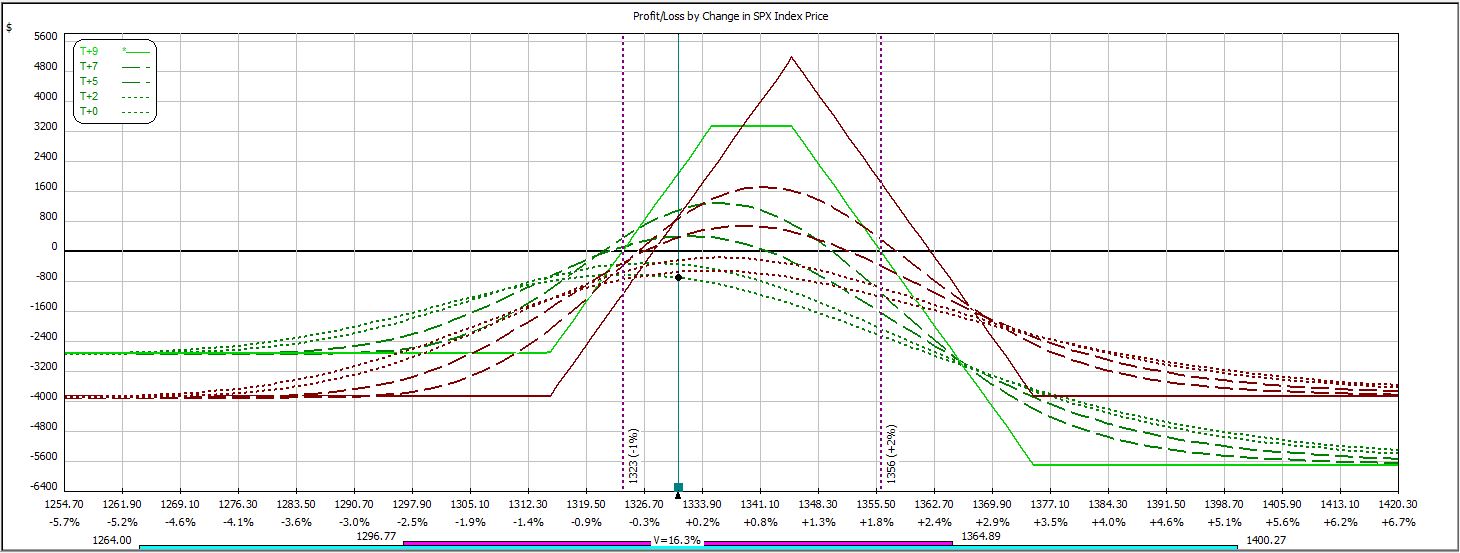
Near the close of Day 1, the downside adjustment is hit as the market has fallen over 10 points:
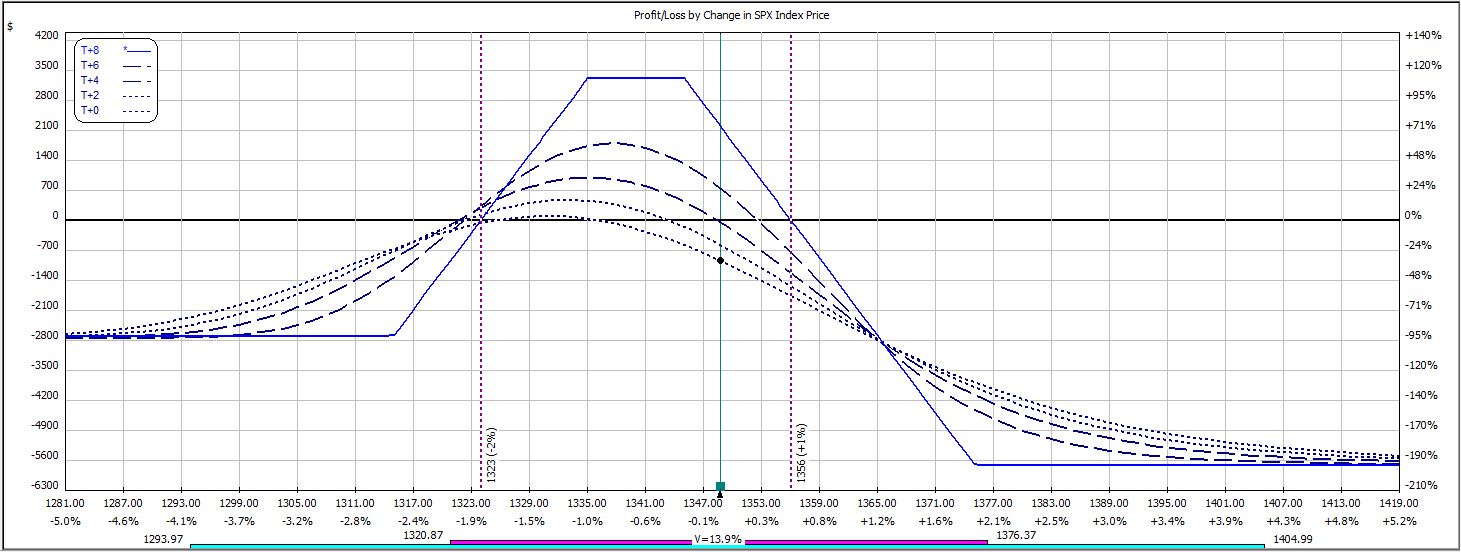
In the final 30 minutes, the market rallied to close within the original 10-point range. The adjustment has already been made, though, and on Day 2 the market continued to rally with conviction. The market gapped open five points higher and was another eight points higher shortly thereafter, which put this trade at max loss:
P/L on Day 1 ranged from -$737 to -$114 on an adjusted margin requirement of $5,712.
The trade closed on Day 2 with a max loss of $924, which is -16.1% on max margin.
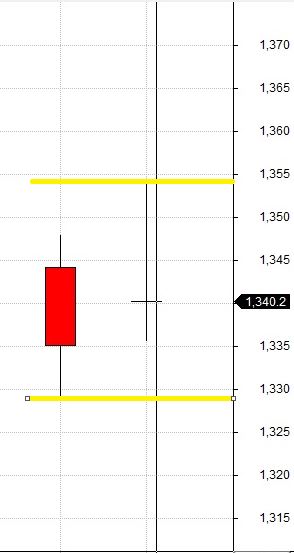
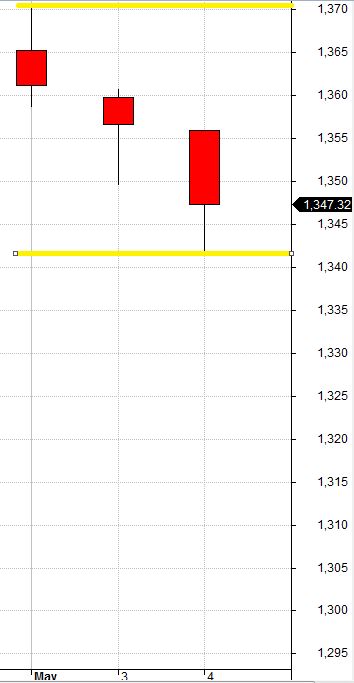
What is killing these trades? This week’s price action looked like:
From the low of one day to the high of the next is a difference of over 25 points! Same goes for last week:
From one day’s high to the low two days later is over 25 points!
This trade adjusts every 10 points and cannot handle much more than one adjustment before max loss is reached. No wonder I’m having so much difficulty.
The trade has now won nine times out of 17 weeks. The average win, however, is $433 while the average loss is $961. A $15,000 account would be down 25.3% to date. The good news is that enough capital remains to continue running this trade (max margin ever seen is $7,137). The bad news is that unless what I’ve seen in these 17 trades is not representative of average market conditions, the account won’t be able to continue running this trade a whole lot longer.
