2012 Performance Evaluation (Part 9)
Posted by Mark on February 22, 2013 at 05:29 | Last modified: February 13, 2013 05:20In http://www.optionfanatic.com/2013/02/20/2012-performance-evaluation-part-8/, I detailed the loss filter (LF) concept and showed performance results with and without the LF. I then went on to describe two potential flaws with the analysis.
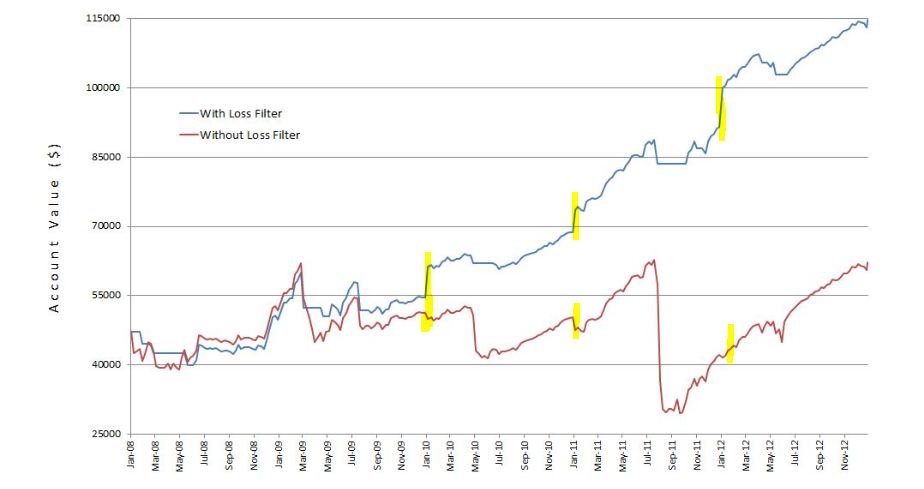
As mentioned previously, when I see shockingly impressive results I tend to scrutinize closely to see if mistakes, either deliberate or inadvertent, have been made. Did you look closely at the graph in the previous post? If so then you might have seen what I did:
When activated, the LF keeps me out of the market, which results in a flat equity curve. The red line should always be gaining when the blue line is gaining because the red line is always in the market (no LF). Highlighted in yellow above are three occurrences where the blue line was gaining and the red line either gained much less or lost.
As it turns out, I made a mistake in the spreadsheet at year-end 2009, 2010, and 2011!
I will continue this analysis in my next post.
Categories: Accountability | Comments (1) | Permalink