2012 Performance Evaluation (Part 8)
Posted by Mark on February 21, 2013 at 06:41 | Last modified: February 13, 2013 05:21In http://www.optionfanatic.com/2013/02/19/2012-performance-evaluation-part-7/, I discussed using the equity curve as a signal to stop trading when it crosses below its own moving average. Another concept I have been considering is to exit the market in favor of paper trading when I have an unusually large weekly drawdown and to resume live trading once consecutive weekly paper gains are posted.
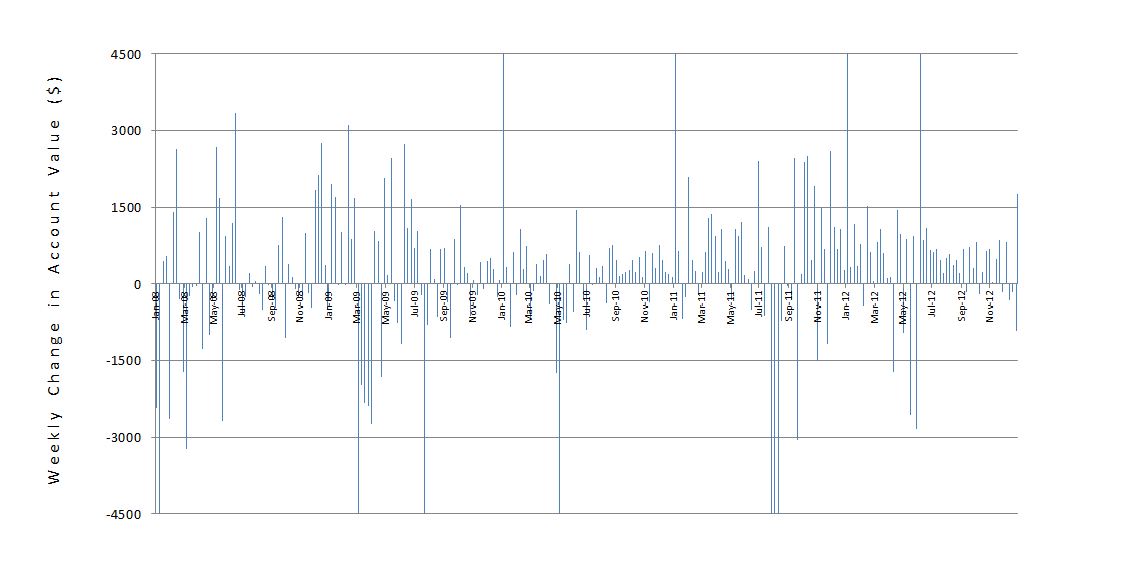
Here is a graph of account value weekly change:
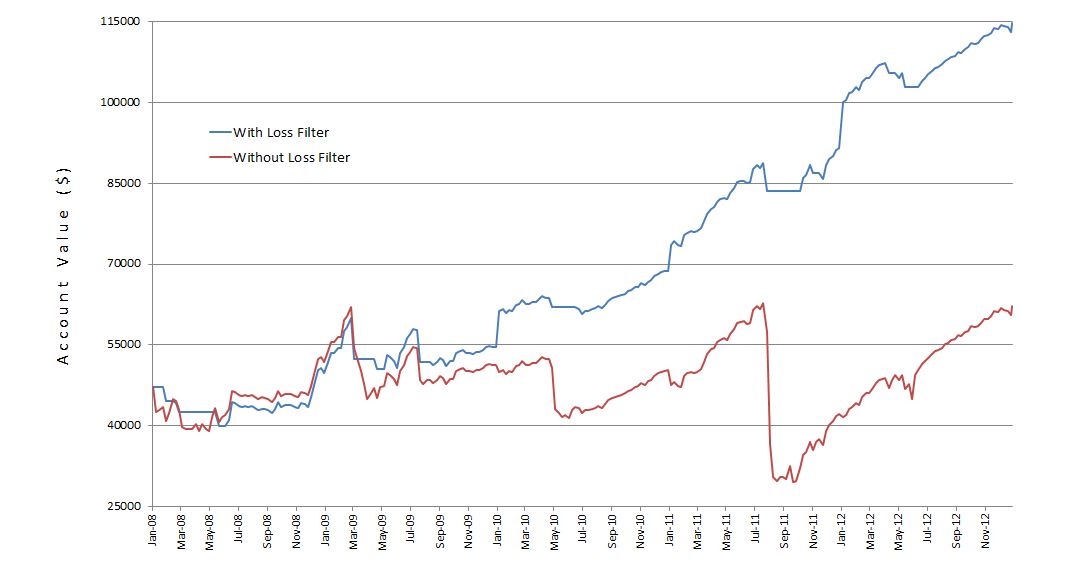
Since 2008, I have made money in about 64% of all weeks. The largest losses seem to be somewhat clustered, though. Suppose I switch to paper after a weekly loss over $3,000 and resume live trading after back-to-back weeks of paper profit The following graph shows the equity curves with and without this “loss filter” (LF):
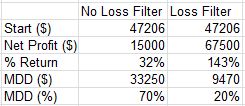
Note the significantly reduced drawdowns–especially March 2009, the Flash Crash, and August 2011. With that ball and chain cut, the profits were really able to run:
Whenever I see shockingly impressive results like these, I want to scrutinize the methodology for potential flaws. I see two such flaws with this analysis. First, I am analyzing a sample of discretionary rather than systematic trading. Position size has varied in an unpredictable fashion and the bigger weekly changes may have occurred when position size was extremely large. With a systematic approach where position size is more controlled, this may not have occurred and the LF may not have been triggered. On the flip side, the hypothetical account did not outperform in all instances where the LF was triggered. I should backtest the strategy in a more systematic fashion and then assess the impact of the LF.
A second potential flaw is arbitrary selection (-$3000 for the LF and two consecutive weeks of profitability) per my post http://www.optionfanatic.com/2012/12/12/flushing-out-the-arbitrary/. I should study the parameter space for plateaus rather than spikes by backtesting different values of the LF and number of consecutive profitable weeks required to resume live trading.


