2012 Performance Evaluation (Part 1)
Posted by Mark on February 11, 2013 at 09:44 | Last modified: February 4, 2013 12:31The main reason I maintain this web site is to keep myself on task with what I want to do. Starting from the “ground up,” system development has been very difficult for me. Without co-workers, it would be easy to give it up and do something else. The web site keeps me accountable.
Along these lines, I want to spend some time focusing on performance to make sure I remain on course in pursuit of personal goals. Getting focused on small details and losing sight of the big picture is very easy to do when you don’t have to check in with bosses and supervisors. I will report here.
As a brief review, I took over the investing for my personal account in mid-2001. In 2008 I resigned from Pharmacy and began life as a full-time trader. My investing/trading approach has changed much over the years and that is important for the here-and-now. With the performance statistics now updated through January 2013, though, I wish to first spend some time looking at the entire history.
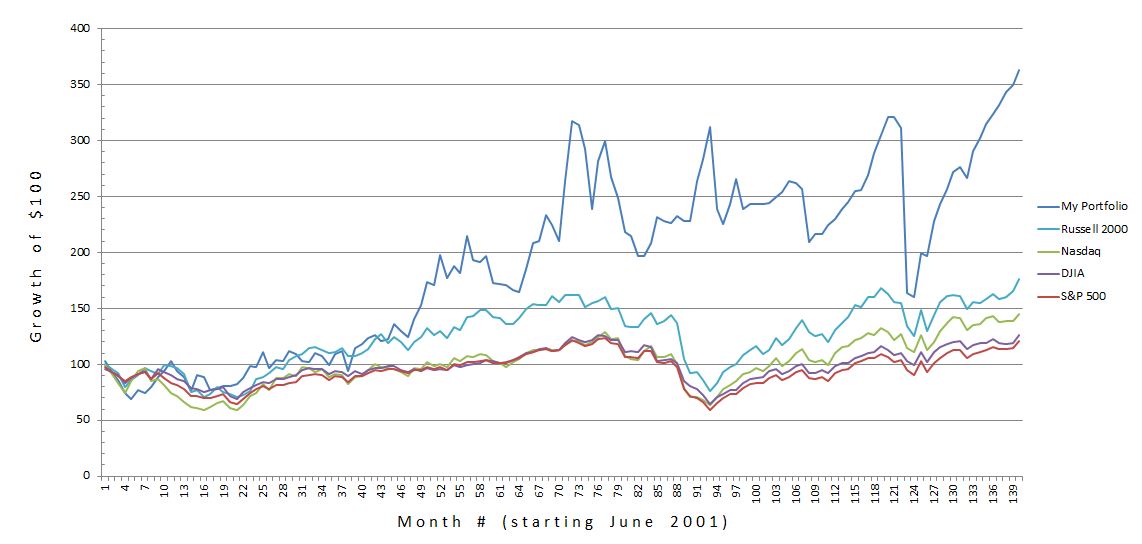
Below is a graph of my total performance to date. I have set the starting account value to be $100. The first graph is plotted with linear scaling:
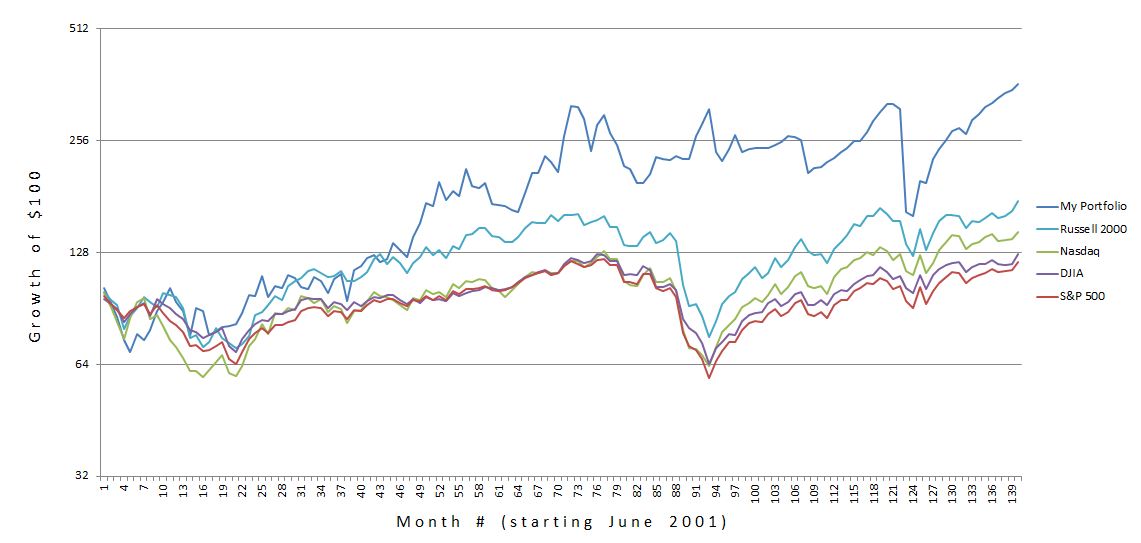
Since linear scaling can sometimes be misleading, below I show the same data with logarithmic scaling. Note here that identical percent changes traverse the same distance along the y-axis:
In my next post, I will begin to analyze and to discuss these data.
Categories: Accountability | Comments (3) | Permalink
