Trading System #3–Naked Puts (Part 4)
Posted by Mark on December 11, 2012 at 04:39 | Last modified: November 26, 2012 06:41In http://www.optionfanatic.com/2012/12/10/trading-system-3-naked-puts-part-3/, I showed how DD can limit position size and annual return despite a high profit factor. The next thing I want to do is conduct a thorough DD analysis. I want to see the distribution of DDs to see if the max DD is typical. I then want to look closer and see if I might be able to minimize DDs.
Before I expend too much energy, I need to boost the sample size to enable statistically valid conclusions. These 113 wins and 16 losses (http://www.optionfanatic.com/2012/12/06/trading-system-3-naked-puts-part-1/ ) compose just one study. I generated every data point by taking account values at Friday’s close (Thursday in case of holiday). I could rerun the backtest and take data points on any other day of the week, which would generate five studies. I could also run Monte Carlo analyses to randomize the trade order. With hundreds to thousands of Monte Carlo simulations, I can get distributions of performance statistics and study values that encompass 95% of the runs to feel more confident about my conclusions.
I must also flush out the arbitrary and make sure these results weren’t simply a matter of luck. Rather than only backtesting a weekly stop-loss of $30K and staying out of the until two positive weeks are seen, I should backtest a range of values (e.g. weekly stop-loss of $20K-$40K in increments of $5K; remaining on the sidelines until one, two, or three consecutive weeks of market gains have been printed). I could study the subjective function (RAR/MDD) and look for plateau regions rather than spike regions across the graphs.
Another thing I might consider aside from using a weekly stop-loss could be a cumulative stop-loss. That is, if DD reaches a certain value then exit whether it takes one week, two weeks, or more to hit that DD.
Categories: System Development | Comments (2) | PermalinkTrading System #3–Naked Puts (Part 3)
Posted by Mark on December 10, 2012 at 03:29 | Last modified: November 24, 2012 09:42In http://www.optionfanatic.com/2012/12/07/trading-system-3-naked-puts-part-2/, I explained why trading the NP system with $200K of initial equity is not feasible because the system could go bust upon max DD. To lower the max DD %, I need to increase initial equity.
How much initial equity is required depends on how much DD I am willing to tolerate. A market crash max DD of 50% would require at least $470K initial equity for the NP system. Most professionals (e.g. hedge fund managers) supposedly aim for a max DD of around 20%, which would require an initial equity of $1.17M. Since “my worst DD is always ahead of me,” I should be even more conservative and multiply this by 1.5. Now my starting account value should be $1.76M to avoid any DD over 20%. Suddenly, that profit of $1.19M (http://www.optionfanatic.com/2012/12/06/trading-system-3-naked-puts-part-1/) is only 67.8% over 12 years rather than 604%. This amounts to a mediocre annual return of 4.40%.
For me personally, the most shocking aspect of this analysis is the high profit factor (PF). I have always liked PF as a trading system metric because it describes number of dollars gained per dollar lost. With the NP system, winning trades outpaced losers by a count of 113 to 16 and the average winner made $18,296 vs. -$54,784 for the average loser. This amounts to a PF over 2.35, which should be like an ATM machine shooting out $100 bills! Reality, though, is a lackluster average annual return of 4.40%.
Bottom line: risk cannot be understood without regard to DD. DDs will generate that pit in my stomach. DDs will induce the psychic pain that will keep me up every night. DDs will change my perception to imagine nothing more refreshing than exiting the market completely to free me of all the stress and worry. The cost of selling out, of course, will be to move that max DD from the unrealized column to the realized one.
I will continue this analysis in my next post.
Categories: Money Management, System Development | Comments (1) | PermalinkTrading System #3–Naked Puts (Part 1)
Posted by Mark on December 6, 2012 at 05:21 | Last modified: November 24, 2012 08:51The words “naked puts” are enough to turn most investors pale white only for the moment before they disappear in a puff of smoke for fear of losing everything. I feel comfortable with naked puts due to several years of live trading and backtesting experience. I would not recommend anybody trade naked puts until and unless they have accrued significant option trading experience along with years of backtesting to become intricately familiar with how they work. I may or may not spend more time writing some educational content later. For now, I want to stick with performance results of this trading system and to start analyzing some implications.
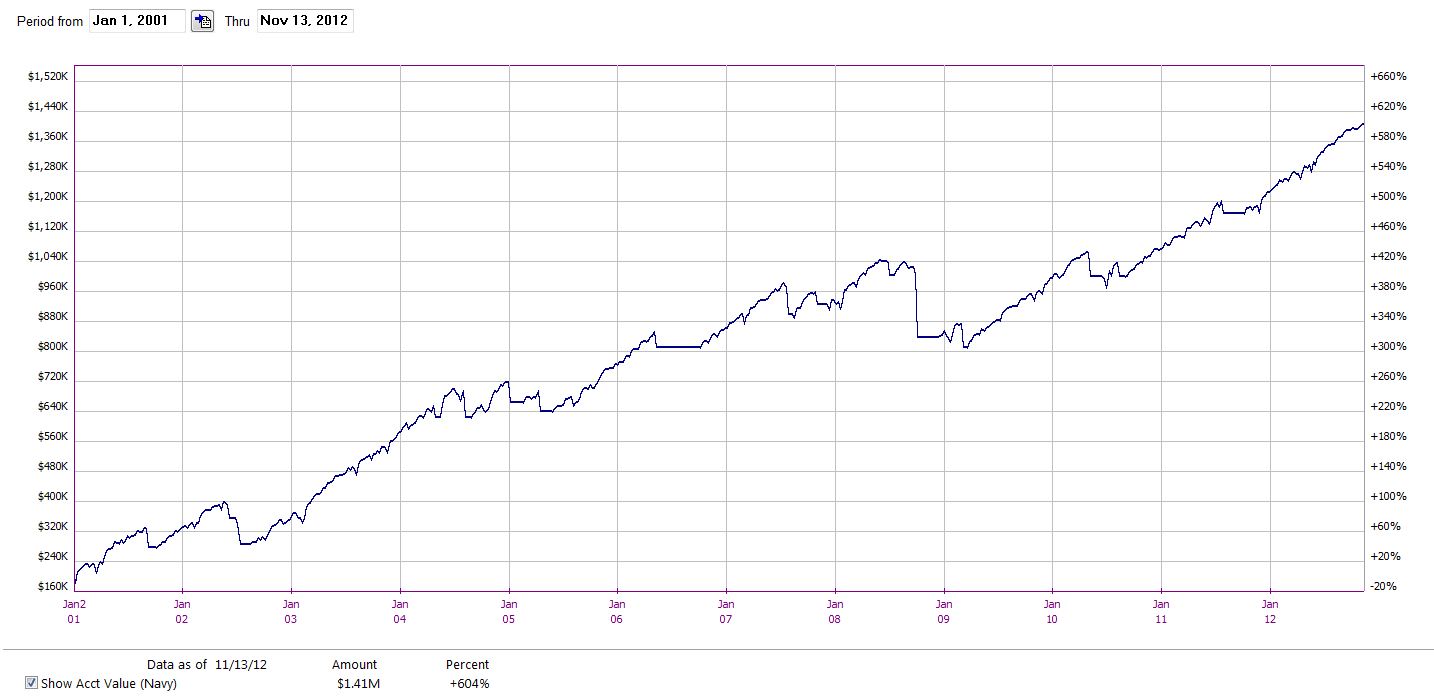
Here is an initial equity curve for the naked puts trading system:
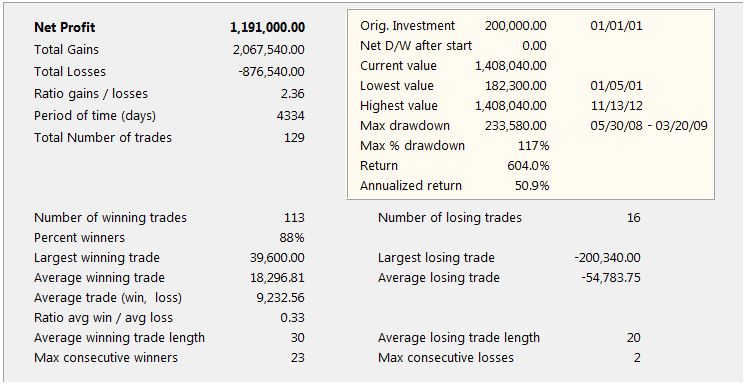
Courtesy OptionVue 7, the initial performance analysis is as follows:
Take a couple minutes and study these numbers. I will begin to delve into the analysis with my next post.
Categories: Backtesting | Comments (2) | PermalinkTrading System #2–Consecutive Directional Close (Part 11)
Posted by Mark on December 5, 2012 at 06:10 | Last modified: November 23, 2012 05:07Back in http://www.optionfanatic.com/2012/10/31/trading-system-2-consecutive-directional-close-part-1, I stated the initial trading claims upon which the CDC trading system is based. I will now assess those claims.
The claims are as follows:
> From 1995-2007, after the SPX has dropped three days in a row, it has risen more
> than 4 times its average weekly gain over the next five trading days.
>
> And, after the SPX has risen three days in a row, it has on average lost money over
> the next five trading days.
My backtesting dates are from 1/29/1993 – 9/30/2012. I have included $8/trade commissions and delays for buy orders (i.e. buy at the next open). The backtesting includes long trades only.
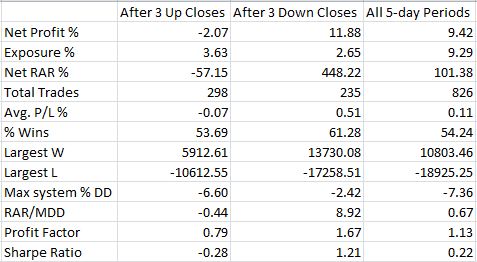
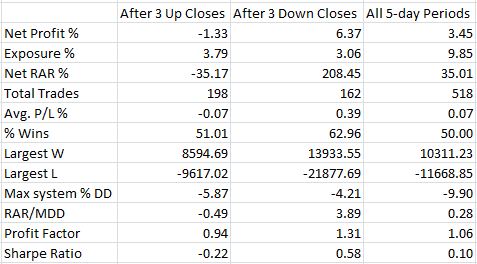
Here are the data for SPY:
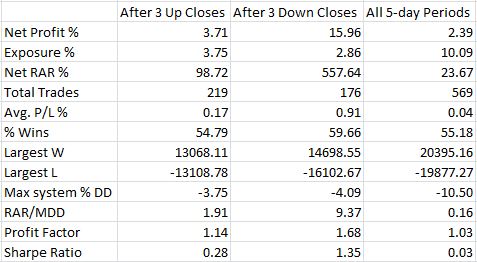
Here are the data for QQQ:
Here are the data for IWM:
The first claim is true. After falling on three consecutive days, the index rose over four, 22, and five times its average weekly gain for SPY, QQQ, and IWM respectively.
The second claim is also true: after rising on three consecutive days, SPY lost money on average over the next five days. This was also the case for IWM.
Categories: System Development | Comments (1) | PermalinkTruth in Backtesting (Part 5)
Posted by Mark on December 4, 2012 at 07:40 | Last modified: November 23, 2012 05:38I am discussing different ways of representing trading rules to understand the truth in backtesting: what allows for consistency with live trading and what does not.
Trading rule #1 was discussed in http://www.optionfanatic.com/2012/12/3/truth-in-backtesting-part-4.
Trading rule #2 is to buy at the close if today’s close is greater than yesterday’s 20-MA. Yesterday’s 20-MA is known after yesterday’s close but today’s close will not be known until after today’s close. If price heading into the close is near yesterday’s 20-MA then tomorrow’s open would be the soonest I could execute this trade with certainty.
Trading rule #3 is to buy at the close if today’s open is greater than yesterday’s 20-MA. Both yesterday’s 20-MA and today’s open are known by today’s close. No problems here.
My observation has been that most people who backtest trading rules write code to match trading rule #1. This applies to crossovers of indicators such as Bollinger Bands, MACD, or RSI. This also applies to crossovers of indicators above or below a critical value. In all cases, I truly do not know indicator values or the closing price until after the close, which leaves great opportunity to trade when I shouldn’t have (or vice versa) if I trade without delays. This will result in performance departure from backtesting results if the backtesting was not performed correctly.
Trading rule #1 is easiest to write and seems to scream loud and clear “buy on a close above the moving average,” but once again I need to stop and analyze at the moment of execution to see if it makes sense. In this case it does not. Taking the easy way out is never in my best interest (see http://www.optionfanatic.com/2012/10/18/laziness-dissected). The only one who stands to be hurt is me when I implement a trading system that looked great in backtesting only to realize much fewer profits or significant losses when I start trading it live.
Categories: System Development | Comments (1) | PermalinkTruth in Backtesting (Part 4)
Posted by Mark on December 3, 2012 at 05:09 | Last modified: November 23, 2012 05:37In http://www.optionfanatic.com/2012/11/30/truth-in-backtesting-part-3, I finished discussing Market on Close orders and raised the possibility that execution at the closing price is doubtful if not impossible to achieve on a routine basis. This may artificially skew backtesting results to the upside. Today, I want to discuss the truth about end-of-day (EOD) trade triggers.
EOD backtesting typically uses daily or weekly time frames with each bar having an open, close, high, and low price. For daily studies, the vast majority of backtesting computes trades based on the day’s close.
Consider a basic moving average crossover system where a long trade is executed or held if the close is greater than the 20-day moving average (20-MA). I am going to ask a question that may itself seem very shocking: is trading such a system even possible?
The trading rule can take three forms. Trading rule #1: buy at the close if today’s close is greater than today’s 20-MA. This is riddled with uncertainty of the sort described in my last post. Today’s closing price is not known until after the close. Today’s 20-MA is not known until after the close because today’s closing price is used in the calculation. I can project what today’s 20-MA will be depending on closing price and monitor price as the close approaches. In some cases it might be clear whether a trade should be made. In other cases it may be impossible to make this determination if price is near the projected 20-MA and the closing ticks of the day become decisive. The soonest I could execute this trade with certainty would then be at the next open.
I will discuss other forms of this trading rule in my next post.
Categories: System Development | Comments (0) | Permalink