Trading System #2–Consecutive Directional Close (Part 5)
Posted by Mark on November 16, 2012 at 07:04 | Last modified: October 30, 2012 10:07As discussed in http://www.optionfanatic.com/2012/11/15/backtesting-conundrum-with-sp-500-stocks, I have not subscribed to delisted data nor does my database tag for index membership with respective time intervals. I therefore must alter course away from backtesting S&P 500 stocks individually.
I can immediately think of three further directions for the Consecutive Directional Close (CDC) trading system. First, I can explore elimination of the more extreme trading criteria that do not generate sufficient sample sizes. Second, I can explore using long trades only since those seemed to perform better in Table 1 of http://www.optionfanatic.com/2012/11/01/trading-system-2-consecutive-directional-close-part-2. Third, I can incorporate other broad-based indices like QQQ and IWM. I will study these in order.
Eliminating the more extreme trading criteria upholds the old adage “don’t throw the baby out with the bath water.” With an inconclusive graph like Figure 1 in http://www.optionfanatic.com/2012/11/07/trading-system-2-consecutive-directional-close-part-4, my academic background suggests scrapping the hypothesis (system) altogether to research elsewhere. The difference here is that the data do not necessarily fail to fit the hypothesis. Rather, due to the insufficient sample size I am unable to determine whether the data fit the hypothesis.
To draw a line in the sand, I will require at least 55 trades as a minimal sample size (I accepted 57 trades for the SPY VIX system). Revisiting Table 1 from http://www.optionfanatic.com/2012/11/06/trading-system-2-consecutive-directional-close-part-3 then leaves me with:
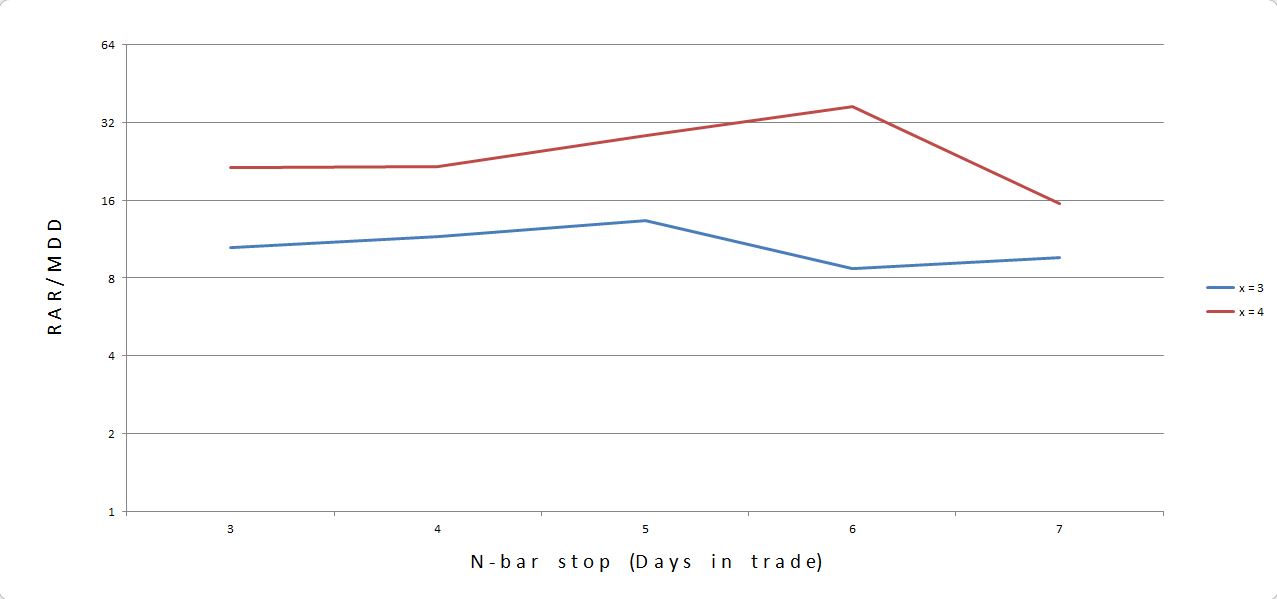
These numbers look pretty good: all 10 systems profitable with profit factors over 1.60, total number of trades in the triple digits, and Sharpe Ratios over 1.00. Graphically, the results look like this:
The x = 4 curve is above the x = 3 curve, which corresponds to better results with more CDCs. Furthermore, the curves are relatively flat as viewed in this logarithmic graph. I would choose n = 5 as the middle.
In the next post, I will continue to explore other directions for the CDC system as described above.
Categories: System Development | Comments (2) | Permalink
