Trading System #2–Consecutive Directional Close (Part 4)
Posted by Mark on November 7, 2012 at 07:14 | Last modified: October 30, 2012 09:45In http://www.optionfanatic.com/2012/11/06/trading-system-2-consecutive-directional-close-part-3, I began to analyze what turned out to be some confusing data. Today I will try to better sort this out and see if the Consecutive Directional Close (CDC) trading system is one to salvage or discard.
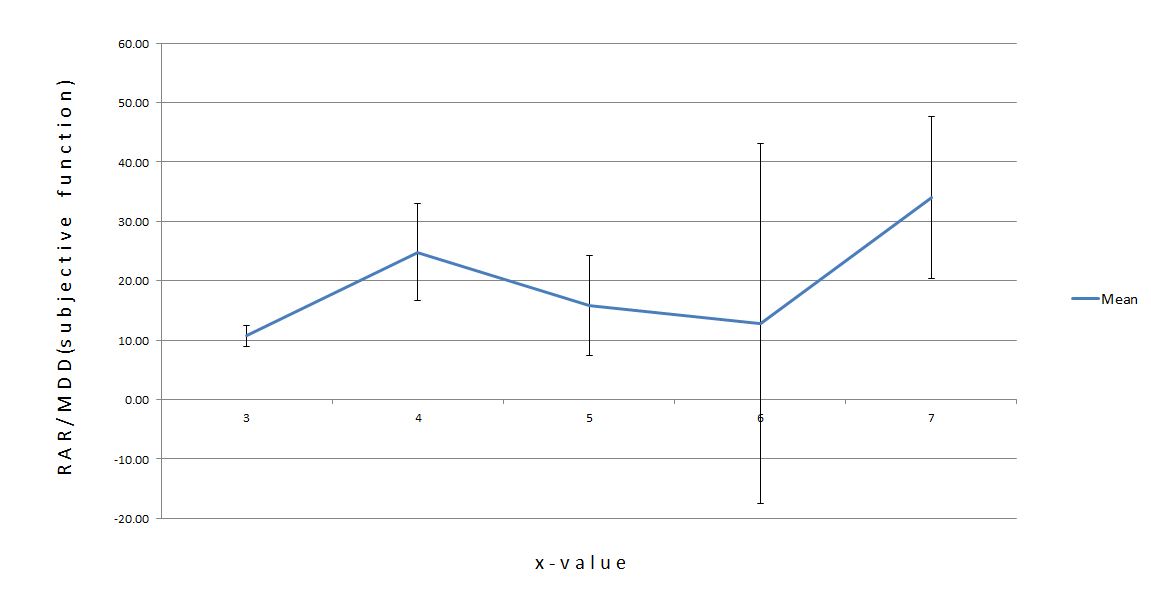
To refresh your memory, you may look back at Figure 1 and Table 2 from the last post. Here is a slightly different snapshot reflecting what I found:
This graph shows the mean RAR/MDD for x ranging from 3 to 7. To establish an x-value as “best,” one point must be separated above the others with no overlapping error bars. Because of the large error bars (especially on x = 6), no points show separation.
Are there any statisticians in the crowd? What is going on here?
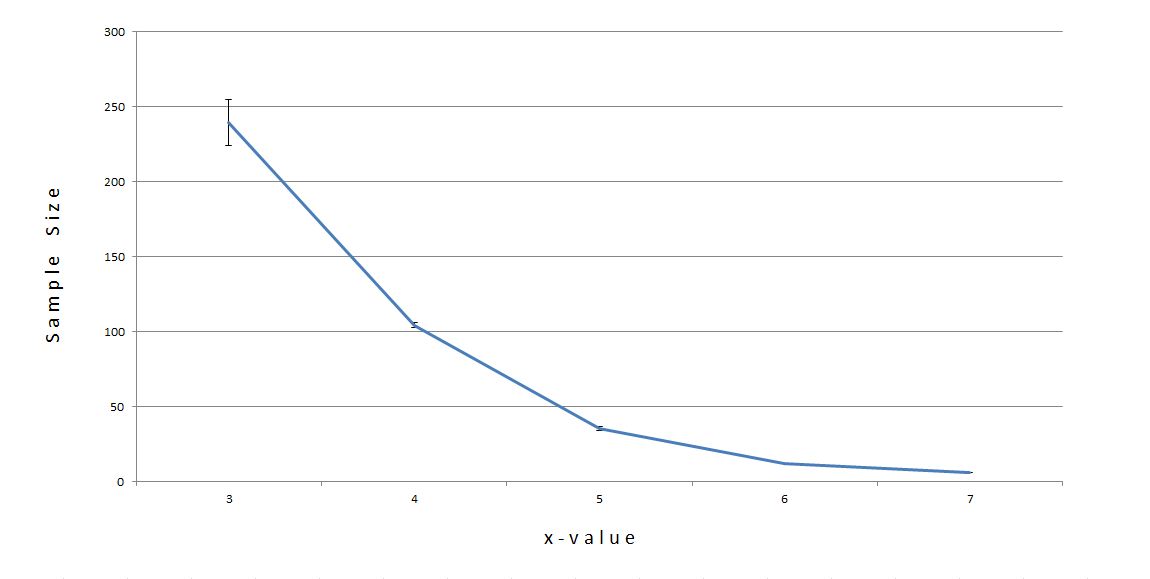
This is a problem with sample size:
The number of trades for x = 5, x = 6, and x = 7 were about 35, 12, and 6 respectively. Those numbers are too small for a valid sample size. I was not overjoyed with 57 trades in http://www.optionfanatic.com/2012/10/25/trading-system-1-spy-vix-part-9 but anything under 50 is totally unacceptable.
I must do something to increase the sample size from which to draw conclusions that may be predictive of future trading. To this end, I have two ideas. First, I can backtest other broad based indices and combine the results of all trades. Second, I can backtest the basket of 500 stocks that constitute the S&P 500 (SPY) separately. Although this may create more problems than it might solve, it can certainly be instructive for me to pursue.
I will continue with this analysis in my next post.


Comments (1)
[…] throw the baby out with the bath water.” With an inconclusive graph like Figure 1 in http://www.optionfanatic.com/2012/11/07/trading-system-2-consecutive-directional-close-part-4, my academic background suggests scrapping the hypothesis (system) altogether to research […]