Trading System #1–SPY VIX (Part 9)
Posted by Mark on October 25, 2012 at 10:15 | Last modified: October 12, 2012 09:01In http://www.optionfanatic.com/2012/10/20/trading-system-1-spy-vix-part-8, I settled on x = 5 to complete selection of the three parameter values for the SPY VIX trading system. It’s not ready for prime time just yet. Today I will begin exploration into Maximum Adverse Excursion (MAE).
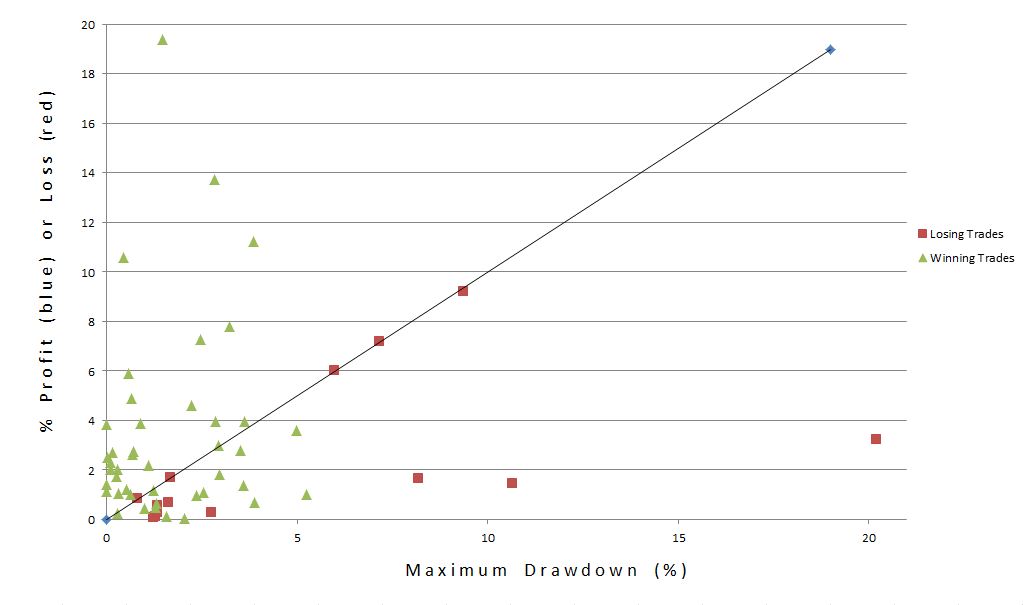
I described the process I am about to undertake in http://www.optionfanatic.com/2012/10/24/maximum-adverse-excursion. Focusing specifically on x = 5, y = 25%, and z = 10, here is a scatter plot of P/L by maximum drawdown (MDD):
The triangles and squares are results of the 57 trades. The higher the point, the greater the profit (green) or loss (red). The farther to the right, the greater the MAE. The [roughly] 45-degree line is called the loss diagonal, and it represents the maximum loss for red squares. Losing trades can never be above the line because the most they can lose is the most they were ever losing (MDD).
A stop-loss would be represented by a vertical line on the graph. Any losing trades to the right of the vertical line would then move to the intersection of the vertical line and the loss diagonal. Any winning trades to the right of the vertical line would become red squares (losing trades) with height equal to the intersection between vertical line and loss diagonal.
What I want to see in order to implement a stop-loss is more of the former that lie above that intersection than below it and few of the latter. Red squares to the right of the vertical line and above the intersection are trades that would be stopped out for a decreased loss (+1 for system). Red squares to the right of the vertical line and below the intersection represent losing trades that would be stopped out before having a chance to recover (-1 for system). Green triangles to the right of the vertical line represent winning trades that would be stopped out for losses before being able to recover into profit (-1 for system).
I don’t see a good place to draw the vertical line such that the +1’s substantially outweigh the -1’s.
Before dismissing a potential stop-loss for this system altogether, I will undertake one more analysis in the next post.
Categories: Backtesting | Comments (0) | Permalink